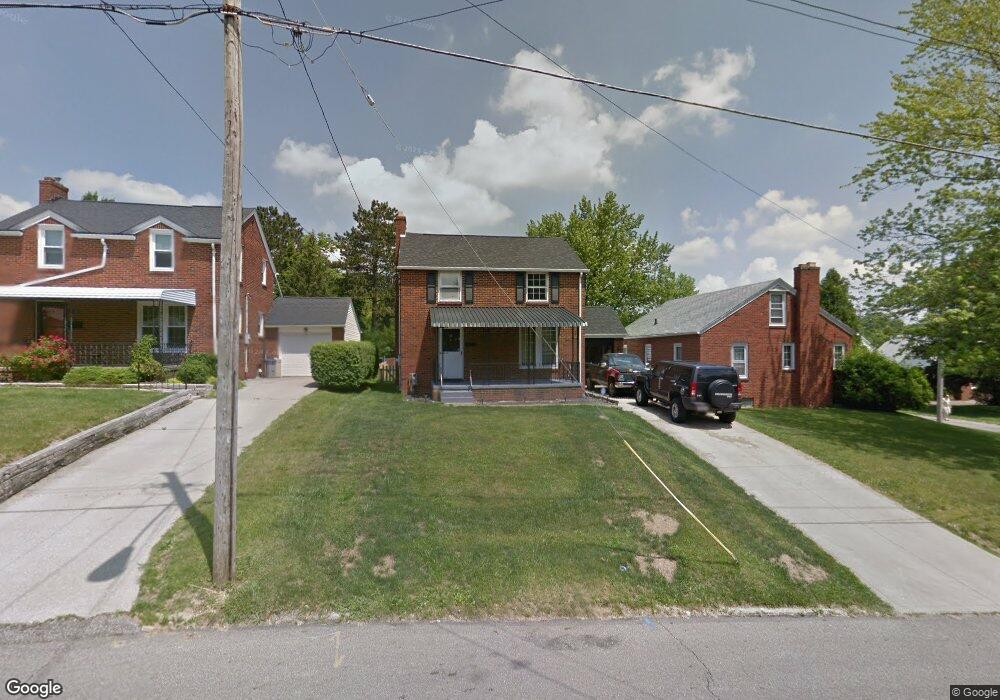
418 Sloane Ave Mansfield, OH 44903
Estimated Value: $46,000 - $141,000
3
Beds
2
Baths
1,230
Sq Ft
$82/Sq Ft
Est. Value
About This Home
This home is located at 418 Sloane Ave, Mansfield, OH 44903 and is currently estimated at $100,840, approximately $81 per square foot. 418 Sloane Ave is a home located in Richland County with nearby schools including Discovery School, St. Peter's Elementary/Montessori School, and St. Peter's Junior High / High School.
Ownership History
Date
Name
Owned For
Owner Type
Purchase Details
Closed on
Apr 21, 2009
Sold by
Rocks Gretchen L and Cooley Gretchen L
Bought by
Rocks Alexander M
Current Estimated Value
Purchase Details
Closed on
Aug 27, 2001
Sold by
Anderson Pamela C
Bought by
Cooley Alexander M Rocks Gretchen L
Home Financials for this Owner
Home Financials are based on the most recent Mortgage that was taken out on this home.
Original Mortgage
$58,900
Outstanding Balance
$23,452
Interest Rate
7.28%
Mortgage Type
New Conventional
Estimated Equity
$77,388
Purchase Details
Closed on
Mar 15, 1995
Sold by
Storms Richie A
Bought by
Anderson Pamela C
Home Financials for this Owner
Home Financials are based on the most recent Mortgage that was taken out on this home.
Original Mortgage
$42,900
Interest Rate
8.97%
Mortgage Type
New Conventional
Purchase Details
Closed on
Aug 1, 1988
Create a Home Valuation Report for This Property
The Home Valuation Report is an in-depth analysis detailing your home's value as well as a comparison with similar homes in the area
Home Values in the Area
Average Home Value in this Area
Purchase History
| Date | Buyer | Sale Price | Title Company |
|---|---|---|---|
| Rocks Alexander M | -- | Chicago Title | |
| Cooley Alexander M Rocks Gretchen L | $62,000 | -- | |
| Anderson Pamela C | $62,900 | -- | |
| -- | $39,500 | -- |
Source: Public Records
Mortgage History
| Date | Status | Borrower | Loan Amount |
|---|---|---|---|
| Open | Cooley Alexander M Rocks Gretchen L | $58,900 | |
| Previous Owner | Anderson Pamela C | $42,900 |
Source: Public Records
Tax History
| Year | Tax Paid | Tax Assessment Tax Assessment Total Assessment is a certain percentage of the fair market value that is determined by local assessors to be the total taxable value of land and additions on the property. | Land | Improvement |
|---|---|---|---|---|
| 2024 | $975 | $20,350 | $2,900 | $17,450 |
| 2023 | $974 | $20,350 | $2,900 | $17,450 |
| 2022 | $794 | $13,900 | $2,360 | $11,540 |
| 2021 | $800 | $13,900 | $2,360 | $11,540 |
| 2020 | $818 | $13,900 | $2,360 | $11,540 |
| 2019 | $906 | $13,900 | $2,360 | $11,540 |
| 2018 | $874 | $13,900 | $2,360 | $11,540 |
| 2017 | $851 | $13,900 | $2,360 | $11,540 |
| 2016 | $1,375 | $21,790 | $3,130 | $18,660 |
| 2015 | $1,314 | $21,790 | $3,130 | $18,660 |
| 2014 | $1,296 | $21,790 | $3,130 | $18,660 |
| 2012 | $520 | $22,950 | $3,300 | $19,650 |
Source: Public Records
Map
Nearby Homes
- 282 Vennum Ave
- 455 Marion Ave
- 487 Davey Ave
- 616 Cline Ave
- 341 Townview Cir N
- 310 Townview Cir N
- 158 Vennum Ave
- 189 Westwood Ave
- 679 Coleman Rd
- 0 Cline Ave Hedeen Abbeyfeale Unit 9066362
- 133 Stewart Ave S
- 456 Lexington Ave
- 466 Lexington Ave
- 470 Lexington Ave
- 151 Grover St
- 119 Carpenter Rd
- 116 Stewart Ave S
- 135 Wood St
- 108 Stewart Ave S
- 575 Crescent Rd
Your Personal Tour Guide
Ask me questions while you tour the home.