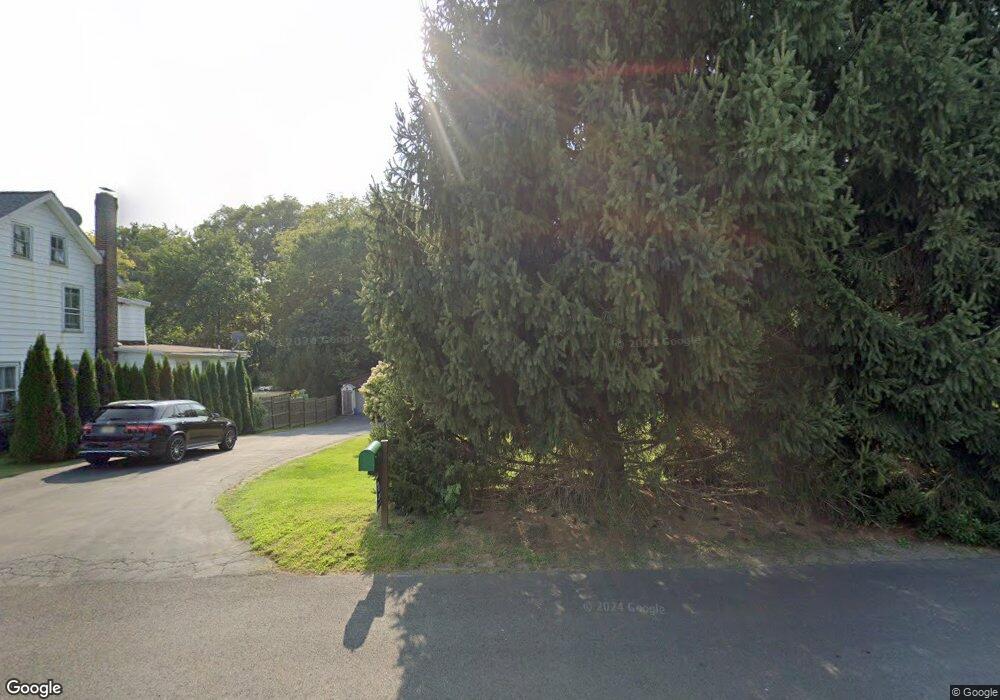
418 Spring St Belvidere, NJ 07823
Estimated Value: $343,000 - $385,000
--
Bed
--
Bath
1,744
Sq Ft
$210/Sq Ft
Est. Value
About This Home
This home is located at 418 Spring St, Belvidere, NJ 07823 and is currently estimated at $366,796, approximately $210 per square foot. 418 Spring St is a home located in Warren County with nearby schools including Belvidere Elementary School, Third Street Elementary School, and Belvidere High School.
Ownership History
Date
Name
Owned For
Owner Type
Purchase Details
Closed on
Jan 11, 2006
Sold by
Bronico Phillip J and Bronico Jacki L
Bought by
Lawyer Thomas A and Triggs Elizabeth M
Current Estimated Value
Home Financials for this Owner
Home Financials are based on the most recent Mortgage that was taken out on this home.
Original Mortgage
$180,000
Outstanding Balance
$101,533
Interest Rate
6.33%
Mortgage Type
Fannie Mae Freddie Mac
Estimated Equity
$265,263
Purchase Details
Closed on
Jan 10, 1997
Sold by
Pensack Edwin A and Pensack Lillian
Bought by
Bronico Phillip J and Rush Jacki L
Home Financials for this Owner
Home Financials are based on the most recent Mortgage that was taken out on this home.
Original Mortgage
$81,600
Interest Rate
7.36%
Create a Home Valuation Report for This Property
The Home Valuation Report is an in-depth analysis detailing your home's value as well as a comparison with similar homes in the area
Home Values in the Area
Average Home Value in this Area
Purchase History
| Date | Buyer | Sale Price | Title Company |
|---|---|---|---|
| Lawyer Thomas A | $358,000 | None Available | |
| Bronico Phillip J | $102,000 | -- |
Source: Public Records
Mortgage History
| Date | Status | Borrower | Loan Amount |
|---|---|---|---|
| Open | Lawyer Thomas A | $180,000 | |
| Previous Owner | Bronico Phillip J | $81,600 |
Source: Public Records
Tax History Compared to Growth
Tax History
| Year | Tax Paid | Tax Assessment Tax Assessment Total Assessment is a certain percentage of the fair market value that is determined by local assessors to be the total taxable value of land and additions on the property. | Land | Improvement |
|---|---|---|---|---|
| 2025 | $8,445 | $265,300 | $90,100 | $175,200 |
| 2024 | $8,166 | $265,300 | $90,100 | $175,200 |
| 2023 | $8,017 | $265,300 | $90,100 | $175,200 |
| 2022 | $8,017 | $136,500 | $49,400 | $87,100 |
| 2021 | $7,742 | $136,500 | $49,400 | $87,100 |
| 2020 | $7,774 | $136,500 | $49,400 | $87,100 |
| 2019 | $7,946 | $136,500 | $49,400 | $87,100 |
| 2018 | $7,946 | $136,500 | $49,400 | $87,100 |
| 2017 | $7,689 | $136,500 | $49,400 | $87,100 |
| 2016 | $7,592 | $136,500 | $49,400 | $87,100 |
| 2015 | $7,453 | $136,500 | $49,400 | $87,100 |
| 2014 | $7,400 | $136,500 | $49,400 | $87,100 |
Source: Public Records
Map
Nearby Homes