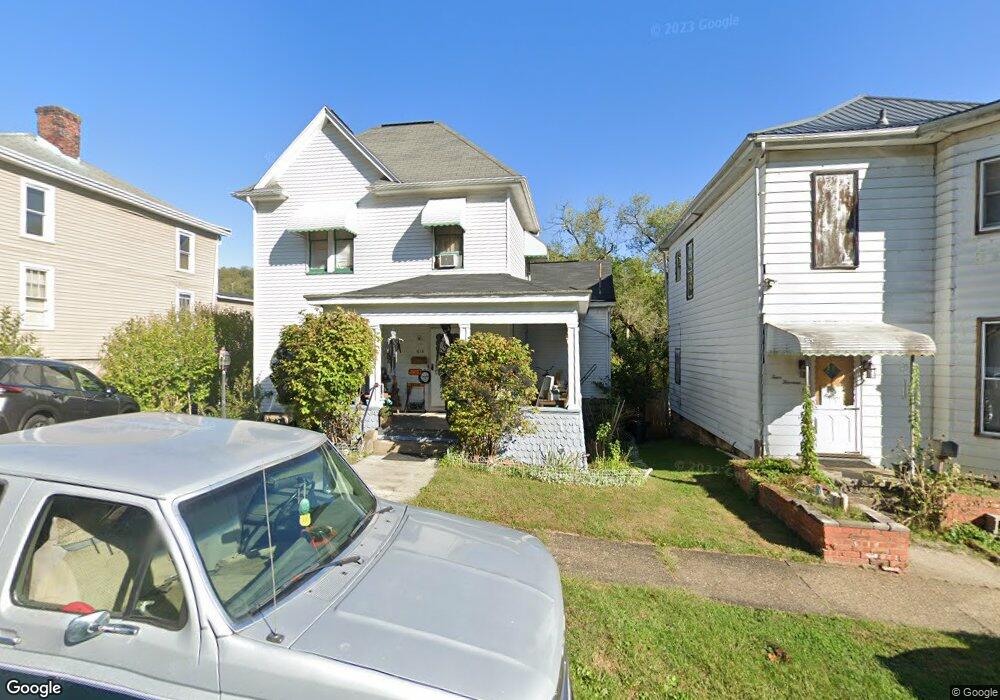
418 Whitely St Bridgeport, OH 43912
Estimated Value: $108,000 - $130,000
3
Beds
1
Bath
1,568
Sq Ft
$75/Sq Ft
Est. Value
About This Home
This home is located at 418 Whitely St, Bridgeport, OH 43912 and is currently estimated at $117,553, approximately $74 per square foot. 418 Whitely St is a home located in Belmont County with nearby schools including Bridgeport Elementary School, Bridgeport Middle School, and Bridgeport High School.
Ownership History
Date
Name
Owned For
Owner Type
Purchase Details
Closed on
Dec 8, 2020
Sold by
Frank Norma M and Thomas Norma M
Bought by
Baker Nicole Rae and Baker Brian
Current Estimated Value
Home Financials for this Owner
Home Financials are based on the most recent Mortgage that was taken out on this home.
Original Mortgage
$75,113
Outstanding Balance
$66,885
Interest Rate
2.71%
Mortgage Type
FHA
Estimated Equity
$50,668
Purchase Details
Closed on
Jan 1, 1987
Sold by
Thomas William E and Nor Thomas
Bought by
Thomas William E and Thomas Nor
Create a Home Valuation Report for This Property
The Home Valuation Report is an in-depth analysis detailing your home's value as well as a comparison with similar homes in the area
Home Values in the Area
Average Home Value in this Area
Purchase History
| Date | Buyer | Sale Price | Title Company |
|---|---|---|---|
| Baker Nicole Rae | $76,500 | None Available | |
| Thomas William E | -- | -- |
Source: Public Records
Mortgage History
| Date | Status | Borrower | Loan Amount |
|---|---|---|---|
| Open | Baker Nicole Rae | $75,113 |
Source: Public Records
Tax History Compared to Growth
Tax History
| Year | Tax Paid | Tax Assessment Tax Assessment Total Assessment is a certain percentage of the fair market value that is determined by local assessors to be the total taxable value of land and additions on the property. | Land | Improvement |
|---|---|---|---|---|
| 2024 | $1,275 | $31,420 | $2,660 | $28,760 |
| 2023 | $950 | $20,840 | $2,670 | $18,170 |
| 2022 | $921 | $20,838 | $2,670 | $18,168 |
| 2021 | $488 | $20,838 | $2,670 | $18,168 |
| 2020 | $323 | $17,370 | $2,230 | $15,140 |
| 2019 | $325 | $17,370 | $2,230 | $15,140 |
| 2018 | $312 | $17,370 | $2,230 | $15,140 |
| 2017 | $283 | $14,850 | $2,540 | $12,310 |
| 2016 | $287 | $14,850 | $2,540 | $12,310 |
| 2015 | $284 | $14,850 | $2,540 | $12,310 |
| 2014 | $190 | $12,480 | $2,310 | $10,170 |
| 2013 | $145 | $12,480 | $2,310 | $10,170 |
Source: Public Records
Map
Nearby Homes
- 8 Spring St
- 61 Laipple St
- 1049 Buckeye St
- 116 Ohio St
- 67730 Kirkwood Heights Rd
- 0 Ohio 7
- 67620 Kirkwood Heights Rd
- 67478 Kirkwood Heights Rd
- 67605 Kirkwood Heights Rd
- 219 S York St
- 866 Main St
- 217 N Huron St
- 50 Kentucky St
- 301 N Huron St
- 25 Kentucky St
- 20 Locust Ave
- 16 Patterson Rd
- 513 S Penn St
- 3 S Front St
- 451 N Wabash St