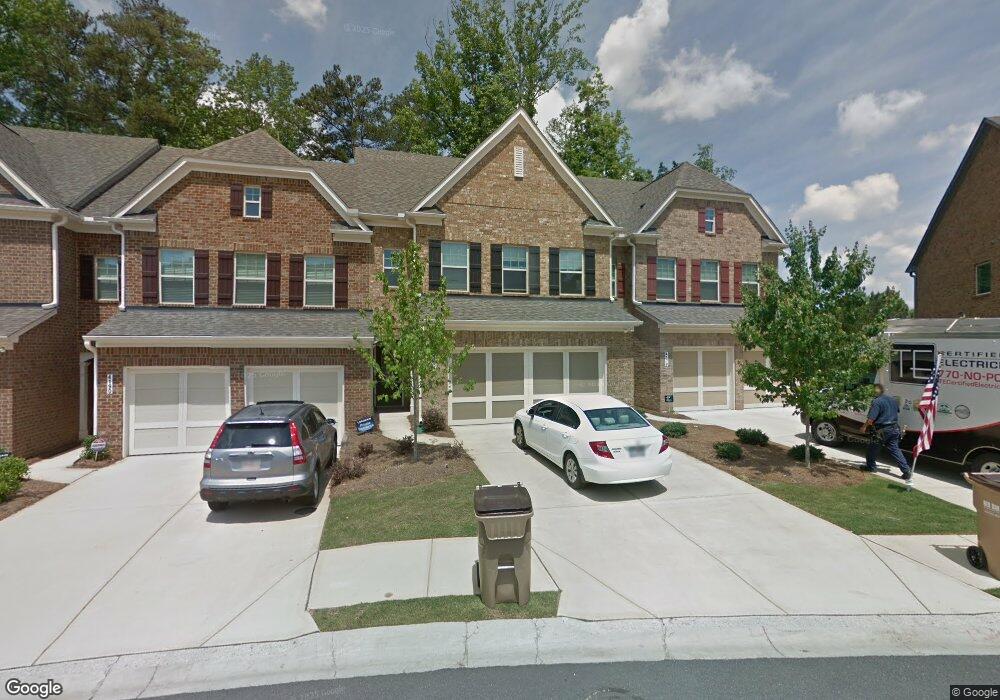
4180 Cedar Bridge Walk Suwanee, GA 30024
Estimated Value: $497,000 - $518,000
4
Beds
4
Baths
2,086
Sq Ft
$245/Sq Ft
Est. Value
About This Home
This home is located at 4180 Cedar Bridge Walk, Suwanee, GA 30024 and is currently estimated at $510,578, approximately $244 per square foot. 4180 Cedar Bridge Walk is a home with nearby schools including Johns Creek Elementary School, Riverwatch Middle School, and Lambert High School.
Ownership History
Date
Name
Owned For
Owner Type
Purchase Details
Closed on
Nov 23, 2021
Sold by
Niu Xifeng
Bought by
Huang Xiao Ling
Current Estimated Value
Purchase Details
Closed on
Oct 12, 2021
Sold by
Niu Xifeng
Bought by
Huang Xiao Ling and Niu Xifeng
Purchase Details
Closed on
Aug 18, 2014
Sold by
Lennar Georgia Inc
Bought by
Niu Xifeng
Home Financials for this Owner
Home Financials are based on the most recent Mortgage that was taken out on this home.
Original Mortgage
$151,300
Interest Rate
5.38%
Create a Home Valuation Report for This Property
The Home Valuation Report is an in-depth analysis detailing your home's value as well as a comparison with similar homes in the area
Home Values in the Area
Average Home Value in this Area
Purchase History
| Date | Buyer | Sale Price | Title Company |
|---|---|---|---|
| Huang Xiao Ling | -- | -- | |
| Huang Xiao Ling | -- | -- | |
| Niu Xifeng | $252,175 | -- |
Source: Public Records
Mortgage History
| Date | Status | Borrower | Loan Amount |
|---|---|---|---|
| Previous Owner | Niu Xifeng | $151,300 |
Source: Public Records
Tax History Compared to Growth
Tax History
| Year | Tax Paid | Tax Assessment Tax Assessment Total Assessment is a certain percentage of the fair market value that is determined by local assessors to be the total taxable value of land and additions on the property. | Land | Improvement |
|---|---|---|---|---|
| 2025 | $3,992 | $200,180 | $78,000 | $122,180 |
| 2024 | $3,992 | $185,836 | $66,000 | $119,836 |
| 2023 | $3,398 | $172,564 | $56,000 | $116,564 |
| 2022 | $3,448 | $120,592 | $40,000 | $80,592 |
| 2021 | $736 | $120,592 | $40,000 | $80,592 |
| 2020 | $3,150 | $124,044 | $56,000 | $68,044 |
| 2019 | $3,223 | $127,332 | $56,000 | $71,332 |
| 2018 | $2,887 | $110,740 | $32,000 | $78,740 |
| 2017 | $2,867 | $109,252 | $32,000 | $77,252 |
| 2016 | $2,730 | $102,772 | $32,000 | $70,772 |
| 2015 | $2,624 | $97,532 | $32,000 | $65,532 |
| 2014 | $847 | $32,000 | $32,000 | $0 |
Source: Public Records
Map
Nearby Homes
- 4150 Cedar Bridge Walk
- 4165 Hammond Bridge Dr
- 5105 Deerlake Dr
- 3910 Dalwood Dr
- 4130 Millbrook Ct
- 3845 Bridle Creek Dr
- 3820 Ridge Point Dr
- 3415 Fox Hollow Way
- 7260 Fawn Lake Dr
- 5235 Villa Lake Ct
- 11800 Carriage Park Ln
- 7520 Ledgewood Way
- 7335 Lytham Trace
- 595 Barsham Way
- 7067 Walham Grove
- 7045 Harlech Trace
- 3150 Thistle Trail
- 8480 St Marlo Fairway Dr
- 6879 Downs Ave
- 5625 Buckleigh Pointe
- 4170 Cedar Bridge Walk
- 4190 Cedar Bridge Walk
- 4190 Cedar Bridge Walk
- 4190 Cedar Bridge Walk
- 4190 Cedar Bridge Walk
- 4210 Cedar Bridge Walk Unit 31
- 4160 Cedar Bridge Walk Unit 27
- 4160 Cedar Bridge Walk
- 4150 Cedar Bridge Walk Unit 26
- 4195 Cedar Bridge Walk
- 4140 Cedar Bridge Walk
- 4205 Cedar Bridge Walk
- 4130 Cedar Bridge Walk Unit 24
- 4130 Cedar Bridge Walk
- 4215 Cedar Bridge Walk
- 4215 Cedar Bridge Walk Unit 67
- 4225 Cedar Bridge Walk Unit 66
- 4225 Cedar Bridge Walk Unit 42
- 4225 Cedar Bridge Walk
- 4235 Cedar Bridge Walk Unit 65