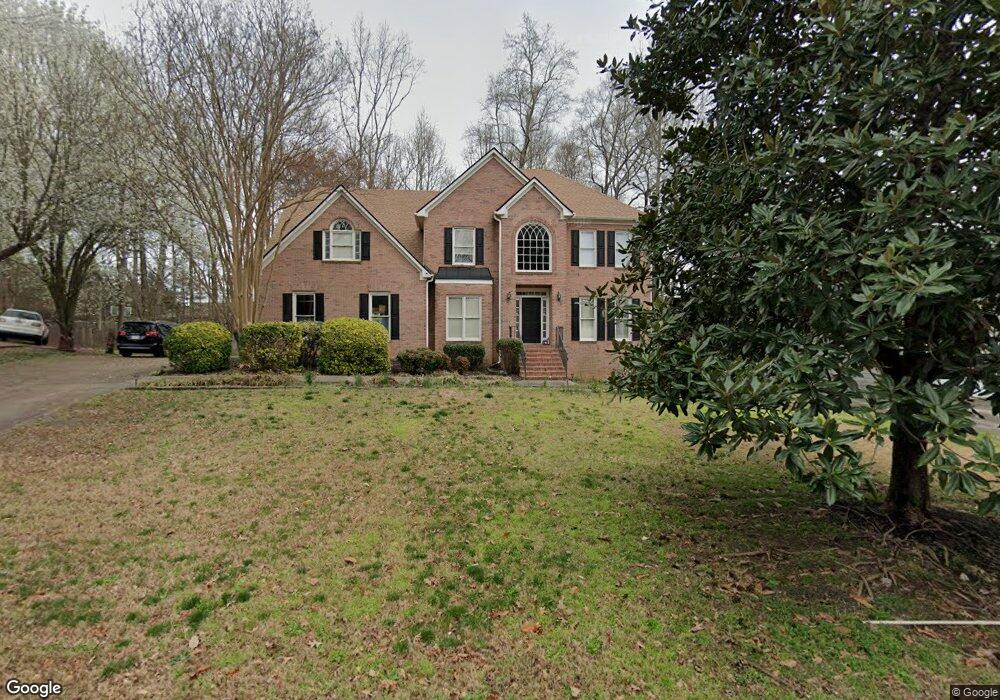
4181 Arapaho Dr Unit 20 Powder Springs, GA 30127
Estimated Value: $431,000 - $446,000
4
Beds
3
Baths
2,572
Sq Ft
$171/Sq Ft
Est. Value
About This Home
This home is located at 4181 Arapaho Dr Unit 20, Powder Springs, GA 30127 and is currently estimated at $439,075, approximately $170 per square foot. 4181 Arapaho Dr Unit 20 is a home located in Cobb County with nearby schools including Tapp Middle School, McEachern High School, and Jubilee Christian Prep Academy.
Ownership History
Date
Name
Owned For
Owner Type
Purchase Details
Closed on
Jun 19, 2015
Sold by
Nelson Steve
Bought by
Hilliard Louis C
Current Estimated Value
Home Financials for this Owner
Home Financials are based on the most recent Mortgage that was taken out on this home.
Original Mortgage
$210,123
Outstanding Balance
$164,866
Interest Rate
4.12%
Mortgage Type
FHA
Estimated Equity
$274,209
Purchase Details
Closed on
Dec 29, 2014
Sold by
Smith Ron Christopher
Bought by
Nelson Steve
Purchase Details
Closed on
May 30, 2003
Sold by
Cendant Mobility Financial Corp
Bought by
Smith Smith R and Smith Katia
Home Financials for this Owner
Home Financials are based on the most recent Mortgage that was taken out on this home.
Original Mortgage
$181,800
Interest Rate
5.79%
Mortgage Type
New Conventional
Create a Home Valuation Report for This Property
The Home Valuation Report is an in-depth analysis detailing your home's value as well as a comparison with similar homes in the area
Home Values in the Area
Average Home Value in this Area
Purchase History
| Date | Buyer | Sale Price | Title Company |
|---|---|---|---|
| Hilliard Louis C | $214,000 | -- | |
| Nelson Steve | $140,000 | -- | |
| Smith Smith R | $202,000 | -- | |
| Cendant Mobility Financial Corp | $207,500 | -- |
Source: Public Records
Mortgage History
| Date | Status | Borrower | Loan Amount |
|---|---|---|---|
| Open | Hilliard Louis C | $210,123 | |
| Previous Owner | Cendant Mobility Financial Corp | $181,800 |
Source: Public Records
Tax History Compared to Growth
Tax History
| Year | Tax Paid | Tax Assessment Tax Assessment Total Assessment is a certain percentage of the fair market value that is determined by local assessors to be the total taxable value of land and additions on the property. | Land | Improvement |
|---|---|---|---|---|
| 2024 | $4,430 | $176,856 | $26,000 | $150,856 |
| 2023 | $3,456 | $156,984 | $26,000 | $130,984 |
| 2022 | $3,894 | $150,860 | $14,000 | $136,860 |
| 2021 | $2,832 | $102,324 | $14,000 | $88,324 |
| 2020 | $3,106 | $102,324 | $14,000 | $88,324 |
| 2019 | $3,106 | $102,324 | $14,000 | $88,324 |
| 2018 | $3,106 | $102,324 | $14,000 | $88,324 |
| 2017 | $1,610 | $55,996 | $10,436 | $45,560 |
| 2016 | $1,610 | $55,996 | $10,436 | $45,560 |
| 2015 | $1,650 | $55,996 | $10,436 | $45,560 |
| 2014 | -- | $75,124 | $0 | $0 |
Source: Public Records
Map
Nearby Homes
- 2499 Sinclair Trace
- 2545 Melville Place
- 2526 New MacLand Rd
- Yellowstone Plan at Linden Grove
- Winthrop Plan at Linden Grove
- Valen Plan at Linden Grove
- Tilden Plan at Linden Grove
- Liston Plan at Linden Grove
- Frazier Plan at Linden Grove
- 2241 Chaseford Ln
- 3837 Thackary Dr
- 2740 Creekside Manor Dr
- 2710 Braemore Glen
- 2015 Augustine Trace
- 2660 Bateman St SW
- 2728 Bateman St SW
- 4545 Gaydon Rd
- 2838 Menton Rd SW
- 1960 Lost Mountain Rd
- 2159 Belmont Trace
- 4181 Arapaho Dr
- 4183 Arapaho Dr
- 41997 Arapaho Dr
- 4179 Arapaho Dr
- 4182 Arapaho Dr
- 4101 Arapaho Ct
- 4185 Arapaho Dr
- 4184 Arapaho Dr
- 4177 Arapaho Dr
- 2459 Arapaho Way
- 4180 Arapaho Dr
- 2457 Arapaho Way
- 2412 Steinbeck Ln
- 2461 Arapaho Way
- 2416 Steinbeck Ln
- 2455 Arapaho Way
- 4175 Arapaho Dr
- 4187 Arapaho Dr
- 4187 Arapaho Dr Unit 4187
- 4187 Arapaho Dr