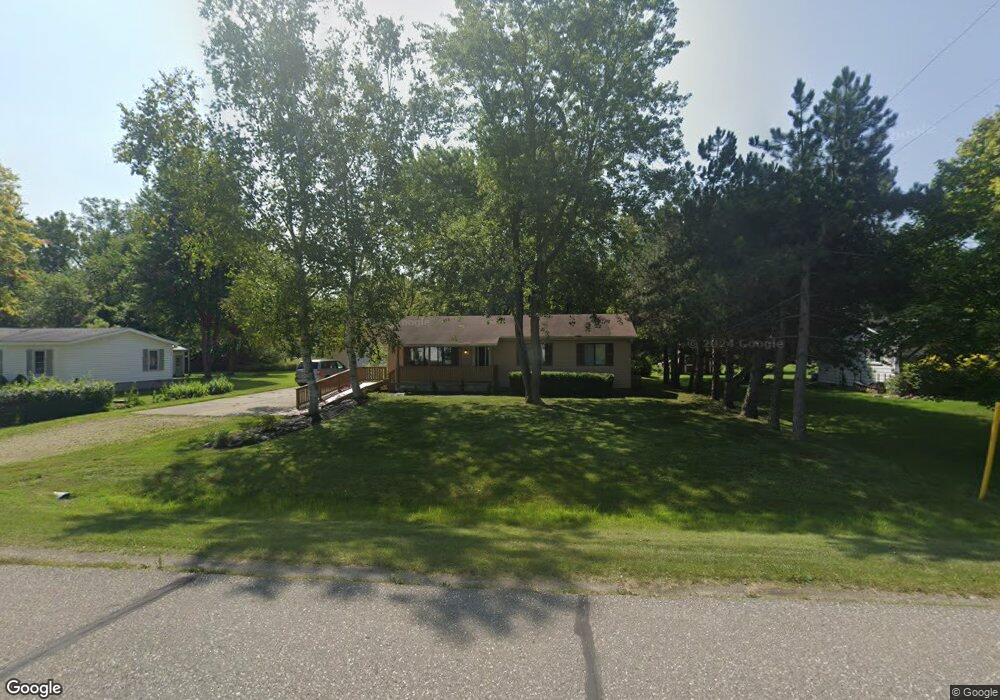
4181 Maes Dr Unit Bldg-Unit Port Huron, MI 48060
Estimated Value: $234,000 - $264,000
--
Bed
1
Bath
1,340
Sq Ft
$184/Sq Ft
Est. Value
About This Home
This home is located at 4181 Maes Dr Unit Bldg-Unit, Port Huron, MI 48060 and is currently estimated at $246,541, approximately $183 per square foot. 4181 Maes Dr Unit Bldg-Unit is a home located in St. Clair County with nearby schools including Michigamme Elementary School, Central Middle School, and Port Huron High School.
Ownership History
Date
Name
Owned For
Owner Type
Purchase Details
Closed on
Aug 17, 2018
Sold by
Oakley Michael A
Bought by
Inch Jeanette L
Current Estimated Value
Home Financials for this Owner
Home Financials are based on the most recent Mortgage that was taken out on this home.
Original Mortgage
$146,276
Outstanding Balance
$127,035
Interest Rate
4.5%
Mortgage Type
New Conventional
Estimated Equity
$119,506
Purchase Details
Closed on
Aug 8, 2018
Sold by
Oakley Michael A
Bought by
Inch Jeanette L
Home Financials for this Owner
Home Financials are based on the most recent Mortgage that was taken out on this home.
Original Mortgage
$146,276
Outstanding Balance
$127,035
Interest Rate
4.5%
Mortgage Type
New Conventional
Estimated Equity
$119,506
Purchase Details
Closed on
Aug 14, 2013
Sold by
Oakley Larry E
Bought by
Oakley Larry E and Oakley Michael A
Create a Home Valuation Report for This Property
The Home Valuation Report is an in-depth analysis detailing your home's value as well as a comparison with similar homes in the area
Home Values in the Area
Average Home Value in this Area
Purchase History
| Date | Buyer | Sale Price | Title Company |
|---|---|---|---|
| Inch Jeanette L | $150,800 | None Listed On Document | |
| Inch Jeanette L | $150,800 | None Listed On Document | |
| Inch Jeanette L | $151,000 | None Available | |
| Oakley Larry E | -- | None Available |
Source: Public Records
Mortgage History
| Date | Status | Borrower | Loan Amount |
|---|---|---|---|
| Open | Inch Jeanette L | $146,276 | |
| Closed | Inch Jeanette L | $146,276 |
Source: Public Records
Tax History Compared to Growth
Tax History
| Year | Tax Paid | Tax Assessment Tax Assessment Total Assessment is a certain percentage of the fair market value that is determined by local assessors to be the total taxable value of land and additions on the property. | Land | Improvement |
|---|---|---|---|---|
| 2025 | $2,910 | $117,400 | $0 | $0 |
| 2024 | $1,531 | $115,800 | $0 | $0 |
| 2023 | $1,413 | $106,500 | $0 | $0 |
| 2022 | $2,611 | $86,400 | $0 | $0 |
| 2021 | $2,395 | $81,600 | $0 | $0 |
| 2020 | $2,395 | $76,100 | $76,100 | $0 |
| 2019 | $2,346 | $70,200 | $0 | $0 |
| 2018 | $2,889 | $0 | $0 | $0 |
| 2017 | $70 | $0 | $0 | $0 |
| 2016 | $0 | $0 | $0 | $0 |
| 2015 | -- | $0 | $0 | $0 |
| 2014 | -- | $0 | $0 | $0 |
| 2013 | -- | $49,100 | $0 | $0 |
Source: Public Records
Map
Nearby Homes
- 2863 Beach Rd
- 0000 W Water St
- 3152 Spruce Dr
- 4380 Lapeer Rd
- 3115 Spruce Dr
- 4224 Atkins Rd
- 2940 Westland Dr
- 4608 Huntington Dr
- 3230 Range Rd
- 4361 Peck Rd
- 3345 Beach Rd
- 3408 N Burwick Dr
- 4460 Cambridge Dr
- 3335 W Water St
- 0 Lapeer Rd Unit 50137357
- 4911 Castlewood Dr
- 3409 Ancient Dr
- 0 Wall Rd Unit 50185999
- 2566 Lewis Dr
- 3971 N River Rd