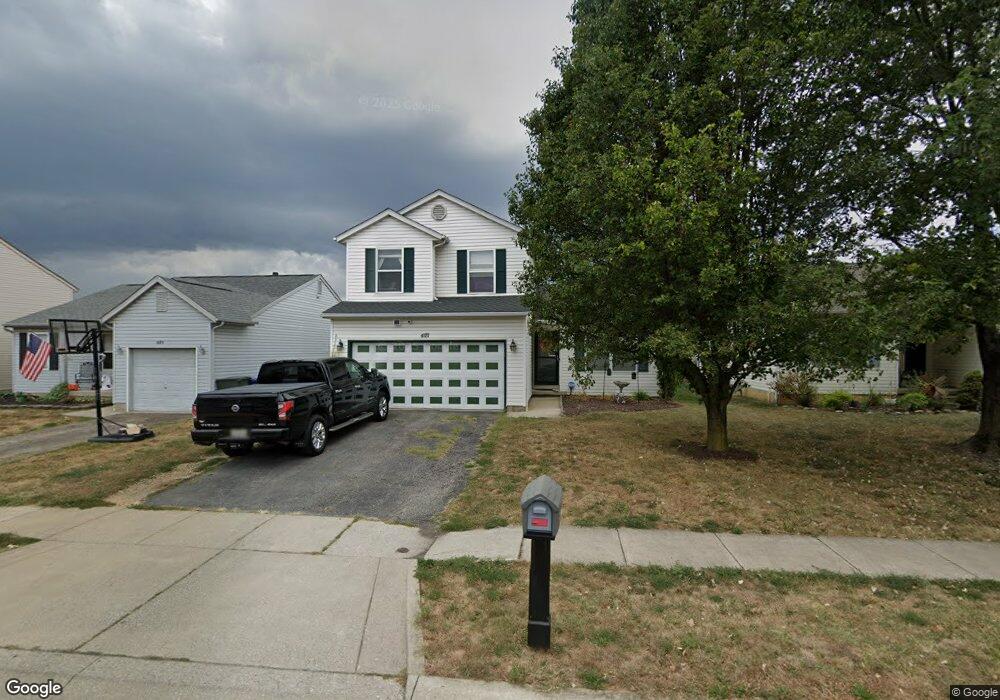
4181 Nipigon Dr Columbus, OH 43207
Obetz-Lockbourne NeighborhoodEstimated Value: $280,701 - $309,000
3
Beds
3
Baths
1,540
Sq Ft
$190/Sq Ft
Est. Value
About This Home
This home is located at 4181 Nipigon Dr, Columbus, OH 43207 and is currently estimated at $291,925, approximately $189 per square foot. 4181 Nipigon Dr is a home located in Franklin County with nearby schools including Hamilton Intermediate School, Hamilton Elementary School, and Hamilton Middle School.
Ownership History
Date
Name
Owned For
Owner Type
Purchase Details
Closed on
Nov 21, 2006
Sold by
Grenier Stephen and Bettinger Terri
Bought by
Prindle Eddie H and Prindle Goldie M
Current Estimated Value
Home Financials for this Owner
Home Financials are based on the most recent Mortgage that was taken out on this home.
Original Mortgage
$136,000
Outstanding Balance
$94,122
Interest Rate
9.47%
Mortgage Type
Balloon
Estimated Equity
$197,803
Purchase Details
Closed on
Nov 25, 2005
Sold by
Hud
Bought by
Grenier Stephen
Home Financials for this Owner
Home Financials are based on the most recent Mortgage that was taken out on this home.
Original Mortgage
$77,600
Interest Rate
9.12%
Mortgage Type
Fannie Mae Freddie Mac
Purchase Details
Closed on
May 4, 2005
Sold by
Oliver Wayne T and Citimortgage Inc
Bought by
Hud
Purchase Details
Closed on
May 31, 2002
Sold by
Crossmann Communities Of Ohio Inc
Bought by
Oliver Wayne T and Oliver Amanda R
Home Financials for this Owner
Home Financials are based on the most recent Mortgage that was taken out on this home.
Original Mortgage
$137,786
Interest Rate
6.87%
Mortgage Type
FHA
Create a Home Valuation Report for This Property
The Home Valuation Report is an in-depth analysis detailing your home's value as well as a comparison with similar homes in the area
Home Values in the Area
Average Home Value in this Area
Purchase History
| Date | Buyer | Sale Price | Title Company |
|---|---|---|---|
| Prindle Eddie H | $136,000 | Focus Title | |
| Grenier Stephen | $97,000 | Lakeside Ti | |
| Hud | $84,000 | -- | |
| Oliver Wayne T | $138,900 | Chicago Title |
Source: Public Records
Mortgage History
| Date | Status | Borrower | Loan Amount |
|---|---|---|---|
| Open | Prindle Eddie H | $136,000 | |
| Closed | Grenier Stephen | $77,600 | |
| Previous Owner | Oliver Wayne T | $137,786 |
Source: Public Records
Tax History Compared to Growth
Tax History
| Year | Tax Paid | Tax Assessment Tax Assessment Total Assessment is a certain percentage of the fair market value that is determined by local assessors to be the total taxable value of land and additions on the property. | Land | Improvement |
|---|---|---|---|---|
| 2024 | $3,400 | $88,200 | $23,310 | $64,890 |
| 2023 | $3,345 | $88,200 | $23,310 | $64,890 |
| 2022 | $2,228 | $53,380 | $8,890 | $44,490 |
| 2021 | $2,265 | $53,380 | $8,890 | $44,490 |
| 2020 | $2,317 | $53,380 | $8,890 | $44,490 |
| 2019 | $2,137 | $44,940 | $7,420 | $37,520 |
| 2018 | $2,103 | $44,940 | $7,420 | $37,520 |
| 2017 | $2,109 | $44,940 | $7,420 | $37,520 |
| 2016 | $2,055 | $39,940 | $6,550 | $33,390 |
| 2015 | $2,081 | $39,940 | $6,550 | $33,390 |
| 2014 | $2,089 | $39,940 | $6,550 | $33,390 |
| 2013 | $1,071 | $42,035 | $6,895 | $35,140 |
Source: Public Records
Map
Nearby Homes
- 1187 Rendezvous Ln
- 4451 1/2 Lockbourne Rd Unit R
- 1101 Meadow Ln
- 1097 Rendezvous Ln
- 1341 Halfhill Way
- 1091 Vernon Dr
- 965 Radbourne Dr
- 4207 Crosspointe Dr
- 1566 Chillicothe St
- 989 Lavender Ln
- 1632 Marlboro Ave
- 1649 Obetz Ave
- 1583 Metcalfe Ave
- 1068 Tobi Dr
- 1597 Metcalfe Ave
- 864 Robmeyer Dr
- 4410 Holstein Dr
- 904 Kyle Ave
- 1456 Magoffin Ave
- 1118 Maplewood Rd
- 4189 Nipigon Dr
- 4173 Nipigon Dr
- 4197 Nipigon Dr
- 4165 Nipigon Dr
- 4166 Umiak Dr
- 4174 Umiak Dr
- 4158 Umiak Dr
- 4205 Nipigon Dr
- 4182 Umiak Dr
- 4148 Umiak Dr
- 4180 Nipigon Dr
- 4172 Nipigon Dr
- 4190 Umiak Dr
- 4188 Nipigon Dr
- 4213 Nipigon Dr
- 4164 Nipigon Dr
- 4196 Nipigon Dr
- 4156 Nipigon Dr
- 4198 Umiak Dr
- 4204 Nipigon Dr