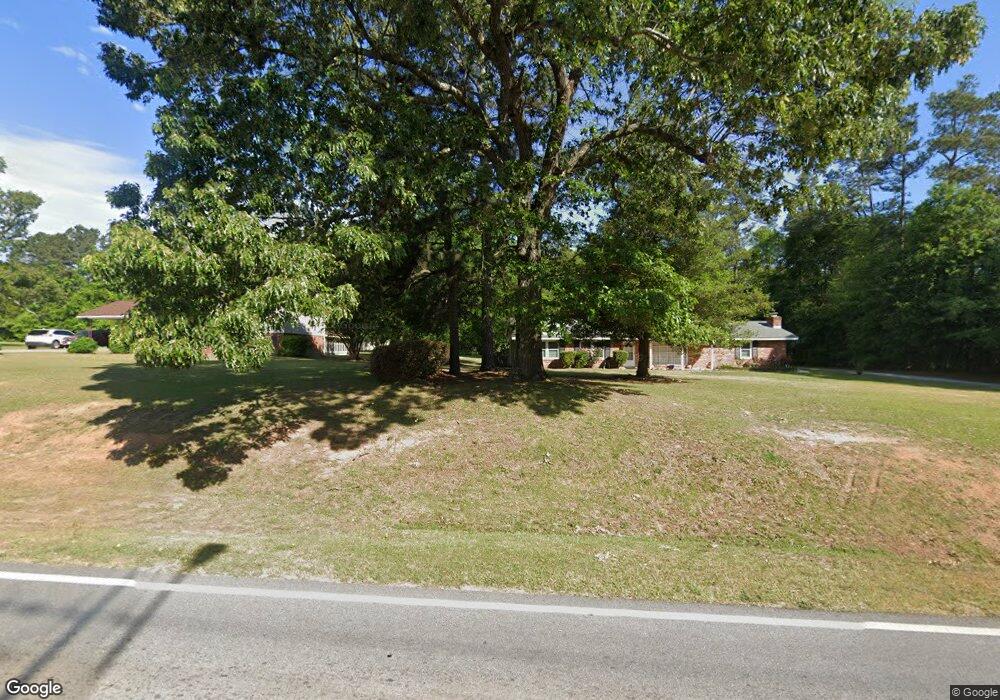
4181 Old Waynesboro Rd Hephzibah, GA 30815
McDade NeighborhoodEstimated Value: $172,307 - $182,000
3
Beds
2
Baths
1,200
Sq Ft
$148/Sq Ft
Est. Value
About This Home
This home is located at 4181 Old Waynesboro Rd, Hephzibah, GA 30815 and is currently estimated at $177,327, approximately $147 per square foot. 4181 Old Waynesboro Rd is a home with nearby schools including Goshen Elementary School, Pine Hill Middle School, and Johnson Magnet.
Ownership History
Date
Name
Owned For
Owner Type
Purchase Details
Closed on
Aug 29, 1997
Sold by
Collier Mary Johnso
Bought by
Johnson Juliette
Current Estimated Value
Home Financials for this Owner
Home Financials are based on the most recent Mortgage that was taken out on this home.
Original Mortgage
$180,540
Interest Rate
7.18%
Mortgage Type
Purchase Money Mortgage
Purchase Details
Closed on
Aug 28, 1997
Sold by
Collier Mary Johnson
Bought by
Johnson Juliette
Home Financials for this Owner
Home Financials are based on the most recent Mortgage that was taken out on this home.
Original Mortgage
$180,540
Interest Rate
7.18%
Mortgage Type
Purchase Money Mortgage
Purchase Details
Closed on
Mar 31, 1992
Sold by
Collier Lamar M and Collier Mary J
Bought by
Collier Lamar M and Collier Mary J
Purchase Details
Closed on
Jul 31, 1991
Sold by
Collier Lamar M Collier Lamar Morgan
Bought by
Collier Mary J
Purchase Details
Closed on
Jul 18, 1991
Sold by
Bowman Ernest
Bought by
Collier Mary J
Create a Home Valuation Report for This Property
The Home Valuation Report is an in-depth analysis detailing your home's value as well as a comparison with similar homes in the area
Home Values in the Area
Average Home Value in this Area
Purchase History
| Date | Buyer | Sale Price | Title Company |
|---|---|---|---|
| Johnson Juliette | $7,000 | -- | |
| Johnson Juliette | -- | -- | |
| Collier Lamar M | -- | -- | |
| Collier Mary J | -- | -- | |
| Collier Mary J | -- | -- |
Source: Public Records
Mortgage History
| Date | Status | Borrower | Loan Amount |
|---|---|---|---|
| Previous Owner | Johnson Juliette | $180,540 |
Source: Public Records
Tax History Compared to Growth
Tax History
| Year | Tax Paid | Tax Assessment Tax Assessment Total Assessment is a certain percentage of the fair market value that is determined by local assessors to be the total taxable value of land and additions on the property. | Land | Improvement |
|---|---|---|---|---|
| 2024 | -- | $60,340 | $3,800 | $56,540 |
| 2023 | $1,335 | $59,996 | $3,800 | $56,196 |
| 2022 | $984 | $26,025 | $3,800 | $22,225 |
| 2021 | $1,164 | $30,013 | $3,800 | $26,213 |
| 2020 | $1,150 | $30,013 | $3,800 | $26,213 |
| 2019 | $1,205 | $30,013 | $3,800 | $26,213 |
| 2018 | $1,212 | $30,013 | $3,800 | $26,213 |
| 2017 | $1,135 | $30,013 | $3,800 | $26,213 |
| 2016 | $1,135 | $30,013 | $3,800 | $26,213 |
| 2015 | $1,142 | $30,013 | $3,800 | $26,213 |
| 2014 | $1,144 | $30,013 | $3,800 | $26,213 |
Source: Public Records
Map
Nearby Homes
- 4149 Markwalter Rd
- 1018 Cedarview Cir
- 1775 Brown Rd
- 1663 Pine Ridge Dr N
- 1675 Pine Ridge Dr N
- 4065 Old Waynesboro Rd
- 1679 Pine Ridge Dr N
- 1686 Pine Ridge Dr N
- 4065 Goshen Lake Dr S
- 1843 Brown Rd
- 1715 Pine Ridge Dr N
- 1723 Pine Ridge Dr N
- 1727 Pine Ridge Dr N
- 4018 Rio Pinar Dr
- 4047 Goshen Lake Dr S
- 1671 Pine Ridge Dr N
- 4331 Big Dipper Cir
- 1724 Pine Ridge Dr N
- 1660 Pine Ridge Dr N
- 1898 McDade Farm Rd
- 4183 Old Waynesboro Rd
- 4185 Old Waynesboro Rd
- 1717 Brown Rd
- 4189 Old Waynesboro Rd
- 1709 Brown Rd
- 4152 Mark Walter Rd
- 4156 Mark Walter Rd
- 4152 Markwalter Rd
- 4160 Mark Walter Rd
- 4148 Mark Walter Rd
- 4148 Markwalter Rd
- 4078 Old Waynesboro Rd
- 4173 Old Waynesboro Rd
- 4169 Old Waynesboro Rd
- 4166 Mark Walter Rd
- 4144 Mark Walter Rd
- 4163 Mark Walter Rd
- 4174 Old Waynesboro Rd
- 4161 Markwalter Rd
- 1721 Brown Rd