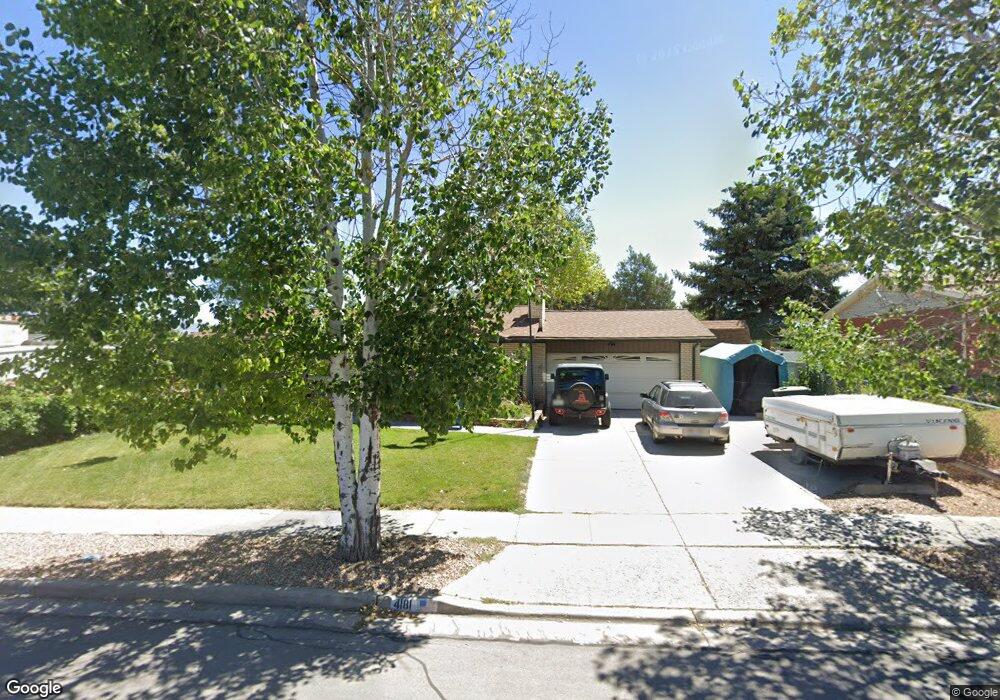
4181 S Deno Dr Salt Lake City, UT 84120
Granger NeighborhoodEstimated Value: $462,502 - $485,000
3
Beds
1
Bath
1,197
Sq Ft
$396/Sq Ft
Est. Value
About This Home
This home is located at 4181 S Deno Dr, Salt Lake City, UT 84120 and is currently estimated at $473,626, approximately $395 per square foot. 4181 S Deno Dr is a home located in Salt Lake County with nearby schools including Philo T Farnsworth Elementary School, Valley Junior High School, and Granger High School.
Ownership History
Date
Name
Owned For
Owner Type
Purchase Details
Closed on
Jul 22, 2013
Sold by
Matthews Gary B
Bought by
Matthews Gary Bradley and Gary Bradley Matthews Living Trust
Current Estimated Value
Purchase Details
Closed on
Oct 17, 2000
Sold by
Matthews Elizabeth L
Bought by
Matthews Gary B
Home Financials for this Owner
Home Financials are based on the most recent Mortgage that was taken out on this home.
Original Mortgage
$122,000
Interest Rate
7.62%
Mortgage Type
Purchase Money Mortgage
Create a Home Valuation Report for This Property
The Home Valuation Report is an in-depth analysis detailing your home's value as well as a comparison with similar homes in the area
Home Values in the Area
Average Home Value in this Area
Purchase History
| Date | Buyer | Sale Price | Title Company |
|---|---|---|---|
| Matthews Gary Bradley | -- | None Available | |
| Matthews Gary B | -- | -- |
Source: Public Records
Mortgage History
| Date | Status | Borrower | Loan Amount |
|---|---|---|---|
| Closed | Matthews Gary B | $122,000 |
Source: Public Records
Tax History Compared to Growth
Tax History
| Year | Tax Paid | Tax Assessment Tax Assessment Total Assessment is a certain percentage of the fair market value that is determined by local assessors to be the total taxable value of land and additions on the property. | Land | Improvement |
|---|---|---|---|---|
| 2025 | $202 | $423,300 | $94,200 | $329,100 |
| 2024 | $202 | $419,800 | $93,600 | $326,200 |
| 2023 | $186 | $373,100 | $90,000 | $283,100 |
| 2022 | $262 | $347,000 | $88,300 | $258,700 |
| 2021 | $156 | $277,700 | $67,900 | $209,800 |
| 2020 | $1,953 | $243,600 | $67,900 | $175,700 |
| 2019 | $1,975 | $237,600 | $64,000 | $173,600 |
| 2018 | $1,877 | $217,600 | $64,000 | $153,600 |
| 2017 | $1,682 | $198,400 | $64,000 | $134,400 |
| 2016 | $1,580 | $186,700 | $64,000 | $122,700 |
| 2015 | $1,506 | $169,400 | $79,200 | $90,200 |
| 2014 | $1,442 | $158,900 | $75,000 | $83,900 |
Source: Public Records
Map
Nearby Homes