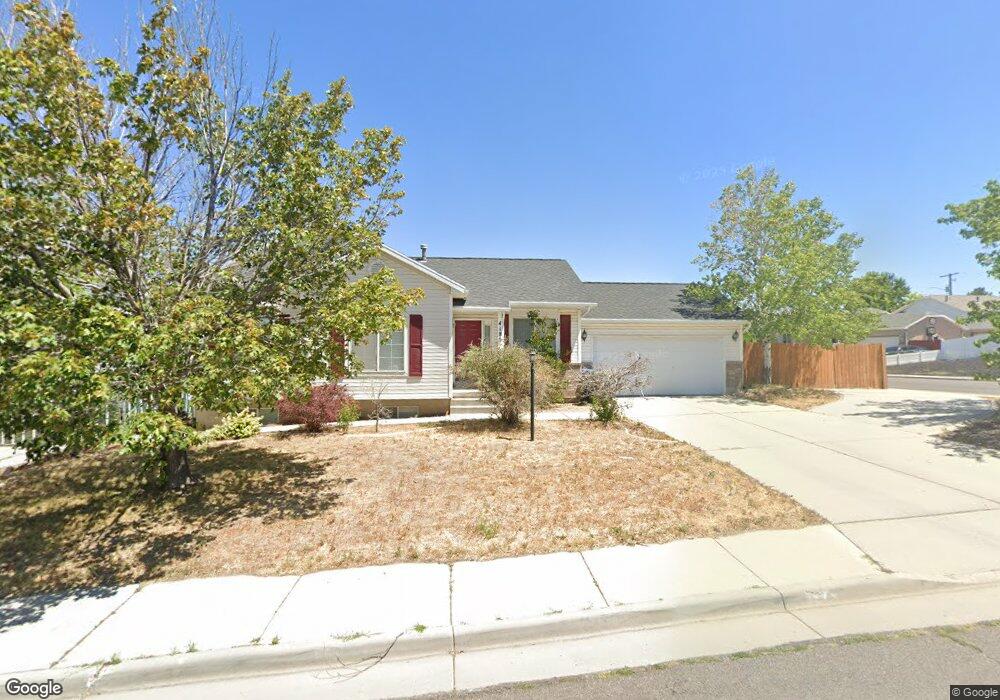
4185 Aubrey Ln Salt Lake City, UT 84128
Hunter NeighborhoodEstimated Value: $458,000 - $488,006
4
Beds
2
Baths
1,054
Sq Ft
$450/Sq Ft
Est. Value
About This Home
This home is located at 4185 Aubrey Ln, Salt Lake City, UT 84128 and is currently estimated at $474,002, approximately $449 per square foot. 4185 Aubrey Ln is a home located in Salt Lake County with nearby schools including Hillside Elementary School, Hunter Jr High School, and Hunter High School.
Ownership History
Date
Name
Owned For
Owner Type
Purchase Details
Closed on
Sep 9, 2016
Sold by
Neilson Michael A and Neilson Emily J
Bought by
Smith Jeffrey A
Current Estimated Value
Home Financials for this Owner
Home Financials are based on the most recent Mortgage that was taken out on this home.
Original Mortgage
$188,000
Outstanding Balance
$150,408
Interest Rate
3.48%
Mortgage Type
New Conventional
Estimated Equity
$323,594
Purchase Details
Closed on
Oct 31, 2000
Sold by
Webb Teresa
Bought by
Neilson Michael A and Neilson Emily J
Home Financials for this Owner
Home Financials are based on the most recent Mortgage that was taken out on this home.
Original Mortgage
$142,943
Interest Rate
7.9%
Mortgage Type
FHA
Purchase Details
Closed on
Sep 21, 1995
Sold by
Watt Residential Partners
Bought by
Lloyd Andre D and Lloyd Samantha
Home Financials for this Owner
Home Financials are based on the most recent Mortgage that was taken out on this home.
Original Mortgage
$75,700
Interest Rate
7.88%
Mortgage Type
Purchase Money Mortgage
Create a Home Valuation Report for This Property
The Home Valuation Report is an in-depth analysis detailing your home's value as well as a comparison with similar homes in the area
Home Values in the Area
Average Home Value in this Area
Purchase History
| Date | Buyer | Sale Price | Title Company |
|---|---|---|---|
| Smith Jeffrey A | -- | Backman Title Services | |
| Neilson Michael A | -- | -- | |
| Lloyd Andre D | -- | First American Title |
Source: Public Records
Mortgage History
| Date | Status | Borrower | Loan Amount |
|---|---|---|---|
| Open | Smith Jeffrey A | $188,000 | |
| Previous Owner | Neilson Michael A | $142,943 | |
| Previous Owner | Lloyd Andre D | $75,700 |
Source: Public Records
Tax History Compared to Growth
Tax History
| Year | Tax Paid | Tax Assessment Tax Assessment Total Assessment is a certain percentage of the fair market value that is determined by local assessors to be the total taxable value of land and additions on the property. | Land | Improvement |
|---|---|---|---|---|
| 2025 | $2,756 | $466,600 | $154,800 | $311,800 |
| 2024 | $2,756 | $420,700 | $142,000 | $278,700 |
| 2023 | $2,700 | $394,500 | $136,600 | $257,900 |
| 2022 | $2,744 | $402,200 | $133,900 | $268,300 |
| 2021 | $3,054 | $325,900 | $103,000 | $222,900 |
| 2020 | $2,264 | $281,300 | $84,000 | $197,300 |
| 2019 | $2,291 | $274,600 | $79,300 | $195,300 |
| 2018 | $2,175 | $251,800 | $79,300 | $172,500 |
| 2017 | $2,016 | $237,300 | $79,300 | $158,000 |
| 2016 | $1,803 | $212,600 | $79,300 | $133,300 |
| 2015 | $1,685 | $189,200 | $86,300 | $102,900 |
| 2014 | $1,610 | $177,100 | $83,400 | $93,700 |
Source: Public Records
Map
Nearby Homes
- 4197 S 6115 W
- 5905 W 4300 S
- 4345 S Long Valley Dr
- 4205 S Zeus Dr
- 5960 W 4385 S
- 6081 W Haven Ridge Way
- 5944 W Vistas Haven Way Unit 34
- 6165 W Haven Ridge Way
- 5644 W 4360 S
- 6104 W Peach Ridge Way
- 4483 Rodonda Linda Place
- 6497 W King Valley Rd
- 5758 W 4510 S
- 5936 W Juniper Vista Dr
- 5950 W 4700 S
- 5496 W Peggy Ln
- 3794 Chatterleigh Rd
- 6344 Basin Ridge Dr
- 3813 S 6300 W
- 6527 W 3940 S
- 4185 S Aubrey Ln
- 4173 Aubrey Ln
- 4182 S 6000 W
- 4172 S 6000 W
- 4199 Richardson Cir
- 6052 Richardson Ln
- 6013 Richardson Ln
- 6052 W Richardson Ln
- 4167 Aubrey Ln
- 4174 Aubrey Ln
- 4174 S Aubrey Ln
- 6013 W Richardson Ln
- 4166 S 6000 W
- 6051 Richardson Ln
- 4168 S Aubrey Ln
- 4168 Aubrey Ln
- 4161 Aubrey Ln
- 4200 Richardson Cir
- 4208 S 6000 W
- 4156 S 6000 W