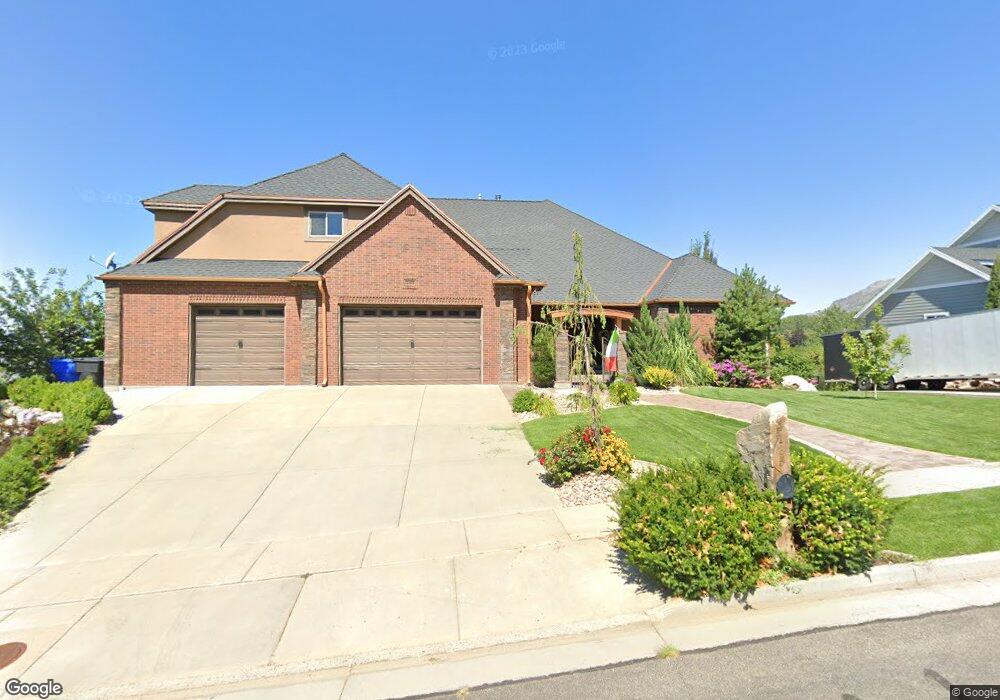
4185 N 300 W Pleasant View, UT 84414
Estimated Value: $1,444,000 - $1,744,000
5
Beds
6
Baths
7,689
Sq Ft
$202/Sq Ft
Est. Value
About This Home
This home is located at 4185 N 300 W, Pleasant View, UT 84414 and is currently estimated at $1,550,476, approximately $201 per square foot. 4185 N 300 W is a home located in Weber County with nearby schools including Lomond View School, Orion Junior High School, and Weber High School.
Ownership History
Date
Name
Owned For
Owner Type
Purchase Details
Closed on
Feb 22, 2021
Sold by
Sumko Nate
Bought by
Digirolamo Benjamin C and Di Girolamo Debra
Current Estimated Value
Home Financials for this Owner
Home Financials are based on the most recent Mortgage that was taken out on this home.
Original Mortgage
$657,610
Outstanding Balance
$588,160
Interest Rate
2.7%
Mortgage Type
FHA
Estimated Equity
$962,316
Purchase Details
Closed on
Jan 12, 2017
Sold by
Wilson Randy Scott and Wilson Janet
Bought by
Sumko Nate
Home Financials for this Owner
Home Financials are based on the most recent Mortgage that was taken out on this home.
Original Mortgage
$417,000
Interest Rate
4.08%
Mortgage Type
New Conventional
Purchase Details
Closed on
Oct 29, 2004
Sold by
Wadman Investments
Bought by
Wilson Randy Scott and Wilson Janet
Create a Home Valuation Report for This Property
The Home Valuation Report is an in-depth analysis detailing your home's value as well as a comparison with similar homes in the area
Home Values in the Area
Average Home Value in this Area
Purchase History
| Date | Buyer | Sale Price | Title Company |
|---|---|---|---|
| Digirolamo Benjamin C | -- | Mountain View Title Ogden | |
| Sumko Nate | -- | Mountain View Title | |
| Wilson Randy Scott | -- | Mountain View Title Ogden |
Source: Public Records
Mortgage History
| Date | Status | Borrower | Loan Amount |
|---|---|---|---|
| Open | Digirolamo Benjamin C | $657,610 | |
| Previous Owner | Sumko Nate | $417,000 |
Source: Public Records
Tax History Compared to Growth
Tax History
| Year | Tax Paid | Tax Assessment Tax Assessment Total Assessment is a certain percentage of the fair market value that is determined by local assessors to be the total taxable value of land and additions on the property. | Land | Improvement |
|---|---|---|---|---|
| 2025 | $8,344 | $1,331,375 | $250,011 | $1,081,364 |
| 2024 | $7,950 | $717,749 | $137,506 | $580,243 |
| 2023 | $7,065 | $638,000 | $137,501 | $500,499 |
| 2022 | $8,015 | $744,700 | $137,501 | $607,199 |
| 2021 | $6,086 | $951,000 | $140,003 | $810,997 |
| 2020 | $5,726 | $826,000 | $120,005 | $705,995 |
| 2019 | $5,868 | $810,000 | $120,005 | $689,995 |
| 2018 | $5,818 | $771,000 | $104,994 | $666,006 |
| 2017 | $6,084 | $765,000 | $104,994 | $660,006 |
| 2016 | $5,467 | $373,491 | $49,259 | $324,232 |
| 2015 | $5,134 | $347,189 | $49,259 | $297,930 |
| 2014 | $5,216 | $347,190 | $49,259 | $297,931 |
Source: Public Records
Map
Nearby Homes
- 4185 N 300 W Unit 176
- 4205 N 300 W Unit 177
- 4205 N 300 W
- 4165 N 300 W
- 4165 N 300 W Unit 175
- 4188 N 350 W
- 4206 N 350 W
- 4190 N 300 W
- 4145 N 300 W
- 4145 N 300 W Unit 174
- 4225 N 300 W Unit 178
- 4225 N 300 W
- 4190 N 300 W Unit 204
- 4190 N 300 W
- 4170 N 350 W
- 4208 N 350 W
- 4174 N 300 W
- 4174 N 300 W Unit 205
- 4158 N 300 W
- 4158 N 300 W Unit 206