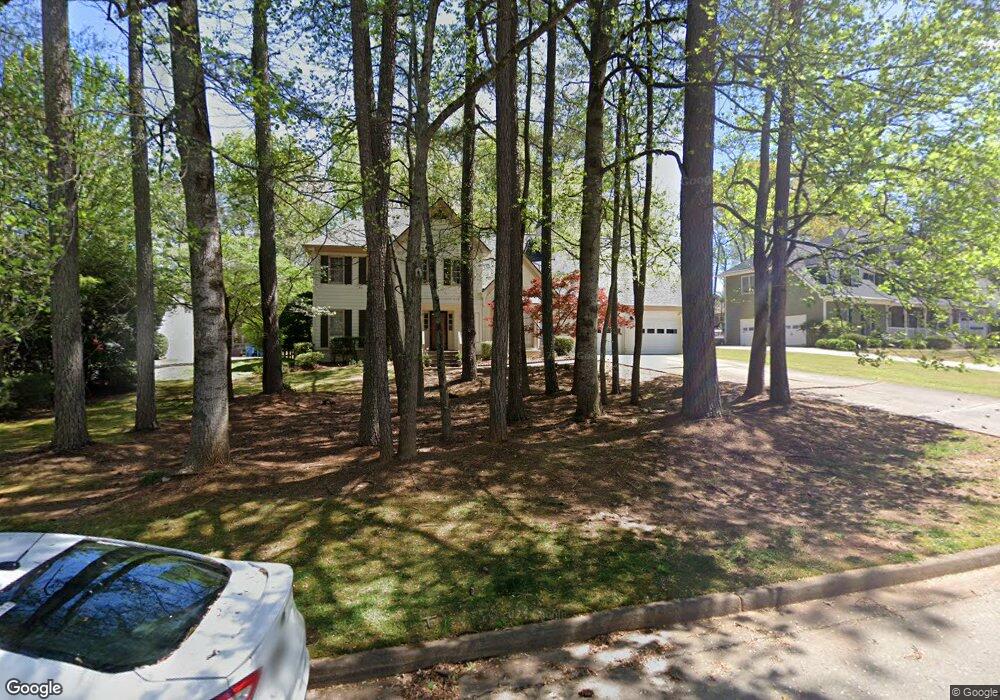
4185 Providence Square Alpharetta, GA 30009
Estimated Value: $788,000 - $950,000
3
Beds
3
Baths
2,928
Sq Ft
$290/Sq Ft
Est. Value
About This Home
This home is located at 4185 Providence Square, Alpharetta, GA 30009 and is currently estimated at $850,156, approximately $290 per square foot. 4185 Providence Square is a home located in Fulton County with nearby schools including Summit Hill Elementary School, Hopewell Middle School, and Cambridge High School.
Ownership History
Date
Name
Owned For
Owner Type
Purchase Details
Closed on
Feb 9, 2001
Sold by
Sonn George F and Sonn Jennifer B
Bought by
L B Marketing Inc
Current Estimated Value
Home Financials for this Owner
Home Financials are based on the most recent Mortgage that was taken out on this home.
Original Mortgage
$164,500
Outstanding Balance
$59,331
Interest Rate
7.06%
Mortgage Type
New Conventional
Estimated Equity
$790,825
Purchase Details
Closed on
Jan 27, 2000
Sold by
Carithers Charles and Carithers Maureen B
Bought by
Adams Don S and Adams Laura V
Home Financials for this Owner
Home Financials are based on the most recent Mortgage that was taken out on this home.
Original Mortgage
$159,000
Interest Rate
7.25%
Mortgage Type
New Conventional
Purchase Details
Closed on
Jun 25, 1996
Sold by
Pavcik Dale L Melissa B
Bought by
Carithers Charles D Maureen
Create a Home Valuation Report for This Property
The Home Valuation Report is an in-depth analysis detailing your home's value as well as a comparison with similar homes in the area
Home Values in the Area
Average Home Value in this Area
Purchase History
| Date | Buyer | Sale Price | Title Company |
|---|---|---|---|
| L B Marketing Inc | $179,500 | -- | |
| Adams Don S | $190,700 | -- | |
| Carithers Charles D Maureen | $178,100 | -- |
Source: Public Records
Mortgage History
| Date | Status | Borrower | Loan Amount |
|---|---|---|---|
| Open | L B Marketing Inc | $164,500 | |
| Previous Owner | Adams Don S | $159,000 | |
| Closed | Carithers Charles D Maureen | $0 |
Source: Public Records
Tax History Compared to Growth
Tax History
| Year | Tax Paid | Tax Assessment Tax Assessment Total Assessment is a certain percentage of the fair market value that is determined by local assessors to be the total taxable value of land and additions on the property. | Land | Improvement |
|---|---|---|---|---|
| 2025 | $511 | $273,960 | $103,920 | $170,040 |
| 2023 | $511 | $264,800 | $87,680 | $177,120 |
| 2022 | $2,330 | $242,320 | $122,200 | $120,120 |
| 2021 | $2,710 | $172,800 | $69,680 | $103,120 |
| 2020 | $2,712 | $163,800 | $66,040 | $97,760 |
| 2019 | $421 | $163,800 | $66,040 | $97,760 |
| 2018 | $2,193 | $163,800 | $66,040 | $97,760 |
| 2017 | $2,254 | $91,920 | $15,360 | $76,560 |
| 2016 | $2,241 | $91,920 | $15,360 | $76,560 |
| 2015 | $2,577 | $91,920 | $15,360 | $76,560 |
| 2014 | $2,308 | $91,920 | $15,360 | $76,560 |
Source: Public Records
Map
Nearby Homes
- 4110 Providence Square
- 2100 Providence Oaks St
- 165 Oakhurst Leaf Dr Unit 4
- 1895 Henley Way
- 4016 Dover Ave
- 406 Woodliff Place
- 1835 Henley Way
- 842 N Brookshade Pkwy
- 925 Pebblestone Ct
- 115 Baxley Ln
- 150 Cobblestone Way
- 141 North Trace
- 1580 Mayfield Rd
- 1645 Mayfield Rd
- 1845 Evergreen Ln
- 5610 Surrey Ct
- 1830 Mayfield Rd
- 4175 Providence Square
- 4195 Providence Square
- 4165 Providence Square
- 4180 Providence Square
- 4170 Providence Square
- 223 Providence Oaks Cir
- 4211 Providence Square
- 1985 Providence Oaks St
- 0 Providence Square Unit 8295863
- 0 Providence Square Unit 8099321
- 0 Providence Square Unit 7573982
- 0 Providence Square Unit 8728056
- 0 Providence Square Unit 7521862
- 0 Providence Square Unit 9044296
- 0 Providence Square Unit 8763159
- 0 Providence Square Unit 8763036
- 0 Providence Square Unit 3105906
- 0 Providence Square Unit 7011763
- 0 Providence Square
- 4190 Providence Square