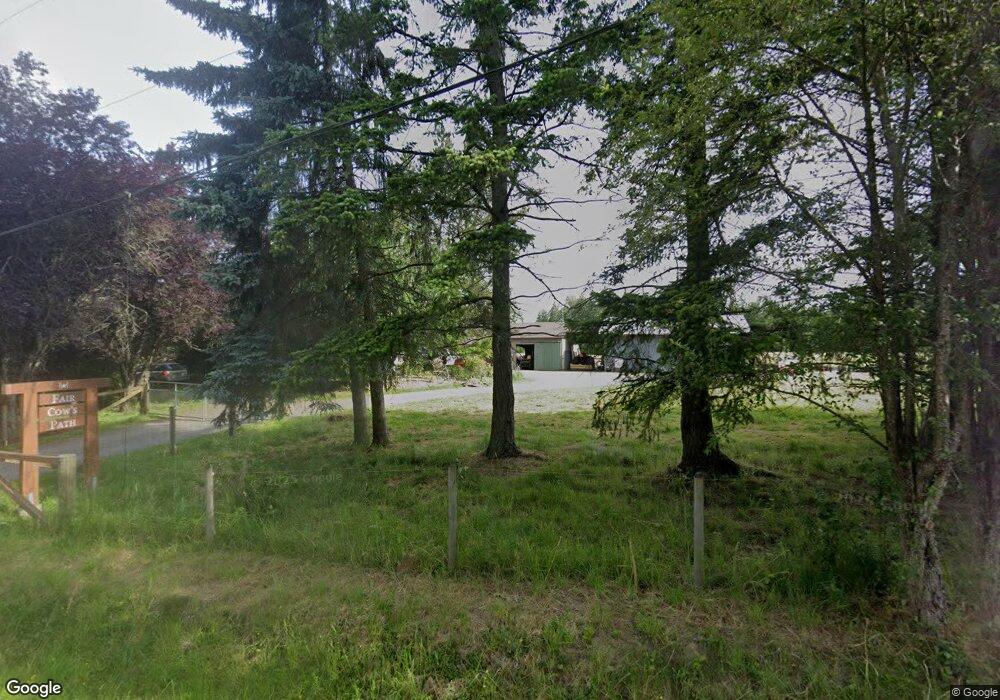
4186 Loomis Trail Rd Blaine, WA 98230
Estimated Value: $620,000 - $842,000
4
Beds
2
Baths
2,000
Sq Ft
$376/Sq Ft
Est. Value
About This Home
This home is located at 4186 Loomis Trail Rd, Blaine, WA 98230 and is currently estimated at $751,848, approximately $375 per square foot. 4186 Loomis Trail Rd is a home located in Whatcom County with nearby schools including Custer Elementary School, Horizon Middle School, and Ferndale High School.
Ownership History
Date
Name
Owned For
Owner Type
Purchase Details
Closed on
Aug 27, 2012
Sold by
Dudenhefer Pete B and Dudenhefer Marie K
Bought by
Dudenhefer Pete B and Dudenhefer Marie K
Current Estimated Value
Purchase Details
Closed on
Jul 19, 2011
Sold by
Newton Robert A and Newton Lisa K
Bought by
Dudenhefer Pete B and Dudenhefer Marie K
Home Financials for this Owner
Home Financials are based on the most recent Mortgage that was taken out on this home.
Original Mortgage
$271,200
Outstanding Balance
$186,048
Interest Rate
4.45%
Mortgage Type
New Conventional
Estimated Equity
$565,800
Purchase Details
Closed on
Nov 10, 2005
Sold by
Eley John F and Eley Esther E
Bought by
Newton Robert A and Newton Lisa K
Home Financials for this Owner
Home Financials are based on the most recent Mortgage that was taken out on this home.
Original Mortgage
$262,000
Interest Rate
5.37%
Mortgage Type
Fannie Mae Freddie Mac
Create a Home Valuation Report for This Property
The Home Valuation Report is an in-depth analysis detailing your home's value as well as a comparison with similar homes in the area
Home Values in the Area
Average Home Value in this Area
Purchase History
| Date | Buyer | Sale Price | Title Company |
|---|---|---|---|
| Dudenhefer Pete B | -- | None Available | |
| Dudenhefer Pete B | $339,280 | First American Title Ins | |
| Newton Robert A | $380,280 | Stewart Title Company |
Source: Public Records
Mortgage History
| Date | Status | Borrower | Loan Amount |
|---|---|---|---|
| Open | Dudenhefer Pete B | $271,200 | |
| Previous Owner | Newton Robert A | $262,000 |
Source: Public Records
Tax History Compared to Growth
Tax History
| Year | Tax Paid | Tax Assessment Tax Assessment Total Assessment is a certain percentage of the fair market value that is determined by local assessors to be the total taxable value of land and additions on the property. | Land | Improvement |
|---|---|---|---|---|
| 2024 | $4,474 | $628,064 | $255,388 | $372,676 |
| 2023 | $4,474 | $628,064 | $255,388 | $372,676 |
| 2022 | $3,878 | $560,771 | $228,025 | $332,746 |
| 2021 | $3,618 | $426,515 | $216,467 | $210,048 |
| 2020 | $3,696 | $361,453 | $183,446 | $178,007 |
| 2019 | $3,062 | $333,131 | $169,072 | $164,059 |
| 2018 | $3,440 | $314,249 | $159,489 | $154,760 |
| 2017 | $3,256 | $269,741 | $136,900 | $132,841 |
| 2016 | $3,011 | $269,741 | $136,900 | $132,841 |
| 2015 | $3,093 | $250,168 | $144,476 | $105,692 |
| 2014 | -- | $250,168 | $144,476 | $105,692 |
| 2013 | -- | $250,168 | $144,476 | $105,692 |
Source: Public Records
Map
Nearby Homes
- 4104 Loomis Trail Rd
- 4435 Castlerock Dr
- 8491 Blaine Rd
- 8610 White Rd
- 4294 Birch Bay Lynden Rd
- 4641 California Trail
- 0 Birch Bay Lynden Rd Unit NWM2457704
- 4476 Birch Bay Lynden Rd
- 3824 Birch Bay Lynden Rd
- 4450 Knorr Ct
- 0 Harvey Rd Unit NWM2270186
- 4255 West Rd
- 4755 Moonglow Place
- 3648 Birch Terrace Ct
- 4672 Birch Bay Lynden Rd Unit 61
- 4672 Birch Bay Lynden Rd Unit 158
- 4672 Birch Bay Lynden Rd Unit 82
- 4591 Sunburst Dr
- 8306 Portal Way
- 7876 Crockett Rd
- 4191 Loomis Trail Rd
- 0 Loomis Trail Unit 43487
- 4128 Loomis Trail Rd
- 0 Loomis Trail Rd Unit 915083
- 0 Loomis Trail Rd Unit 858075
- 0 Loomis Trail Rd Unit 212016
- 0 Loomis Trail Rd Unit 1072061
- 0 Loomis Trail Rd Unit 1018588
- 0 Loomis Trail Rd Unit 97348
- 0 Loomis Trail Rd Unit 37507
- 0 Loomis Trail Rd Unit 29100813
- 0 Loomis Trail Rd Unit 1946176
- 0 Loomis Trail Rd Unit 1467172
- 0 Loomis Trail Rd Unit 1466583
- 1 Loomis Trail Rd
- 4108 Loomis Trail Rd
- 8388 Bridge Way
- 8440 Bridge Way