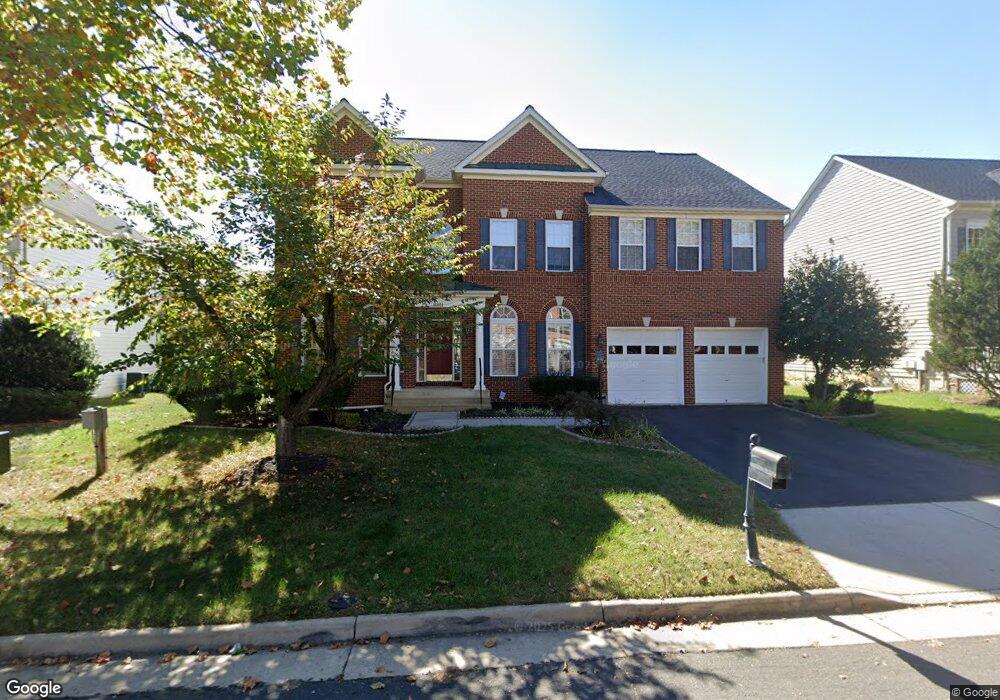
41869 Cordgrass Cir Stone Ridge, VA 20105
Estimated Value: $1,023,000 - $1,176,000
4
Beds
4
Baths
4,200
Sq Ft
$264/Sq Ft
Est. Value
About This Home
This home is located at 41869 Cordgrass Cir, Stone Ridge, VA 20105 and is currently estimated at $1,107,221, approximately $263 per square foot. 41869 Cordgrass Cir is a home located in Loudoun County with nearby schools including Arcola Elementary School, Mercer Middle School, and John Champe High School.
Ownership History
Date
Name
Owned For
Owner Type
Purchase Details
Closed on
Jul 17, 2020
Sold by
Dhiman Naresh and Dhiman Sunita
Bought by
Dhiman Naresh and Dhiman Sunita
Current Estimated Value
Purchase Details
Closed on
Sep 21, 2009
Sold by
Nguyen Anh Q
Bought by
Kumar Naresh and Rani Sunita
Home Financials for this Owner
Home Financials are based on the most recent Mortgage that was taken out on this home.
Original Mortgage
$417,000
Outstanding Balance
$273,961
Interest Rate
5.28%
Mortgage Type
New Conventional
Estimated Equity
$833,260
Purchase Details
Closed on
Nov 3, 2005
Sold by
Van Metre Homes At Stone
Bought by
Nguyen Anh
Home Financials for this Owner
Home Financials are based on the most recent Mortgage that was taken out on this home.
Original Mortgage
$649,900
Interest Rate
6.06%
Mortgage Type
New Conventional
Create a Home Valuation Report for This Property
The Home Valuation Report is an in-depth analysis detailing your home's value as well as a comparison with similar homes in the area
Home Values in the Area
Average Home Value in this Area
Purchase History
| Date | Buyer | Sale Price | Title Company |
|---|---|---|---|
| Dhiman Naresh | -- | None Available | |
| Kumar Naresh | $530,000 | -- | |
| Nguyen Anh | $812,396 | -- |
Source: Public Records
Mortgage History
| Date | Status | Borrower | Loan Amount |
|---|---|---|---|
| Open | Kumar Naresh | $417,000 | |
| Previous Owner | Nguyen Anh | $649,900 |
Source: Public Records
Tax History Compared to Growth
Tax History
| Year | Tax Paid | Tax Assessment Tax Assessment Total Assessment is a certain percentage of the fair market value that is determined by local assessors to be the total taxable value of land and additions on the property. | Land | Improvement |
|---|---|---|---|---|
| 2025 | $8,866 | $1,101,360 | $298,800 | $802,560 |
| 2024 | $8,721 | $1,008,190 | $273,800 | $734,390 |
| 2023 | $7,995 | $913,680 | $273,800 | $639,880 |
| 2022 | $7,709 | $866,190 | $243,800 | $622,390 |
| 2021 | $7,266 | $741,400 | $208,800 | $532,600 |
| 2020 | $7,287 | $704,080 | $198,800 | $505,280 |
| 2019 | $7,041 | $673,790 | $198,800 | $474,990 |
| 2018 | $6,744 | $621,590 | $178,800 | $442,790 |
| 2017 | $6,630 | $589,300 | $178,800 | $410,500 |
| 2016 | $6,863 | $599,390 | $0 | $0 |
| 2015 | $7,020 | $439,670 | $0 | $439,670 |
| 2014 | $6,701 | $401,340 | $0 | $401,340 |
Source: Public Records
Map
Nearby Homes
- 25111 Hummocky Terrace
- 25108 Cypress Mill Terrace
- 41925 Moreland Mine Terrace
- 24876 Helms Terrace
- 25151 Cutgrass Terrace
- 25174 Coats Square
- 25184 Crested Wheat Dr
- 41863 Cinnabar Square
- 41597 Hoffman Dr
- 25362 Vacation Place
- 41971 Blue Flag Terrace
- 41973 Blue Flag Terrace
- 24994 White Fir Ct
- 24686 Nettle Mill Square
- 24636 Woolly Mammoth Terrace Unit 401
- 42020 Glade Creek Terrace
- 42261 Terrazzo Terrace
- 41956 Pickwick Mill Terrace
- 25591 Red Cherry Dr
- 25202 Justice Dr
- 41865 Cordgrass Cir
- 41873 Cordgrass Cir
- 41884 Diabase Square
- 41886 Diabase Square
- 41882 Diabase Square
- 41888 Diabase Square
- 41880 Diabase Square
- 41890 Diabase Square
- 41892 Diabase Square
- 41868 Cordgrass Cir
- 41861 Cordgrass Cir
- 41876 Diabase Square
- 41877 Cordgrass Cir
- 41874 Diabase Square
- 41864 Cordgrass Cir
- 41896 Diabase Square
- 41870 Diabase Square
- 41898 Diabase Square
- 41868 Diabase Square
- 41900 Diabase Square