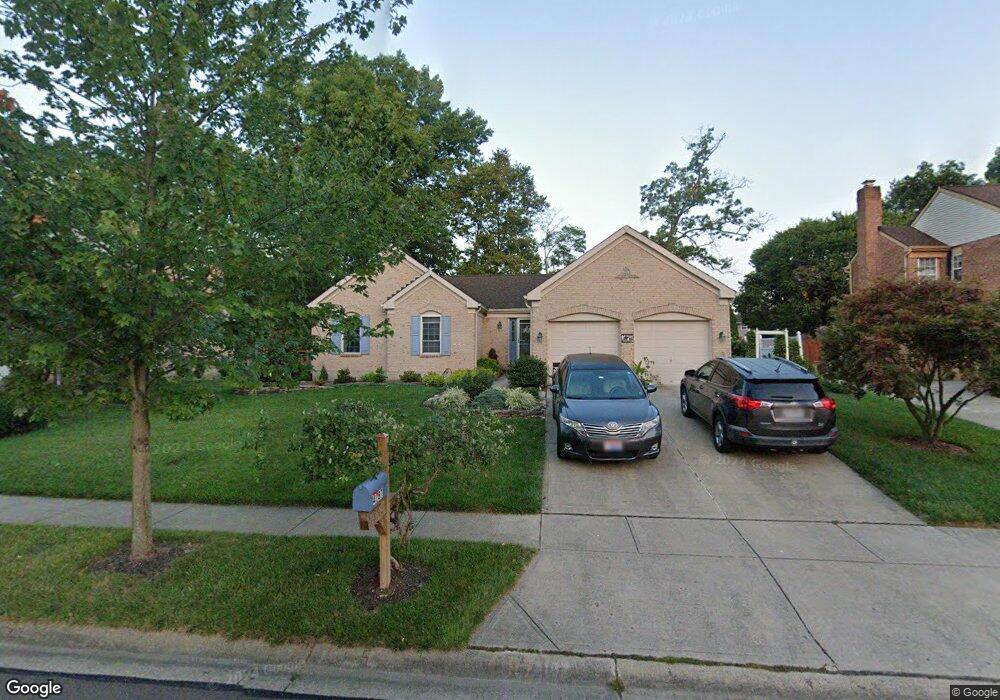
4187 Brandonmore Dr Cincinnati, OH 45255
Estimated Value: $366,593 - $455,000
3
Beds
2
Baths
1,562
Sq Ft
$264/Sq Ft
Est. Value
About This Home
This home is located at 4187 Brandonmore Dr, Cincinnati, OH 45255 and is currently estimated at $412,648, approximately $264 per square foot. 4187 Brandonmore Dr is a home located in Clermont County with nearby schools including Withamsville-Tobasco Elementary School, West Clermont Middle School, and West Clermont High School.
Ownership History
Date
Name
Owned For
Owner Type
Purchase Details
Closed on
May 20, 2002
Sold by
Cady Jonathan H
Bought by
Conover Thomas H and Conover Connie B
Current Estimated Value
Home Financials for this Owner
Home Financials are based on the most recent Mortgage that was taken out on this home.
Original Mortgage
$112,000
Interest Rate
6.68%
Mortgage Type
New Conventional
Purchase Details
Closed on
Aug 19, 1997
Sold by
Drees Co
Bought by
Cady Jonathan H and Cady Ellen J
Home Financials for this Owner
Home Financials are based on the most recent Mortgage that was taken out on this home.
Original Mortgage
$125,000
Interest Rate
7.24%
Mortgage Type
New Conventional
Purchase Details
Closed on
Dec 24, 1996
Sold by
Ven Drees Bartlett Joint
Bought by
Drees Co
Create a Home Valuation Report for This Property
The Home Valuation Report is an in-depth analysis detailing your home's value as well as a comparison with similar homes in the area
Home Values in the Area
Average Home Value in this Area
Purchase History
| Date | Buyer | Sale Price | Title Company |
|---|---|---|---|
| Conover Thomas H | $198,500 | -- | |
| Cady Jonathan H | $168,900 | -- | |
| Drees Co | $25,100 | -- |
Source: Public Records
Mortgage History
| Date | Status | Borrower | Loan Amount |
|---|---|---|---|
| Closed | Conover Thomas H | $112,000 | |
| Previous Owner | Cady Jonathan H | $125,000 |
Source: Public Records
Tax History Compared to Growth
Tax History
| Year | Tax Paid | Tax Assessment Tax Assessment Total Assessment is a certain percentage of the fair market value that is determined by local assessors to be the total taxable value of land and additions on the property. | Land | Improvement |
|---|---|---|---|---|
| 2024 | $4,271 | $92,890 | $20,300 | $72,590 |
| 2023 | $4,309 | $92,890 | $20,300 | $72,590 |
| 2022 | $4,053 | $76,930 | $16,800 | $60,130 |
| 2021 | $4,070 | $76,930 | $16,800 | $60,130 |
| 2020 | $4,074 | $76,930 | $16,800 | $60,130 |
| 2019 | $3,264 | $72,310 | $16,800 | $55,510 |
| 2018 | $3,297 | $72,310 | $16,800 | $55,510 |
| 2017 | $2,880 | $72,310 | $16,800 | $55,510 |
| 2016 | $2,961 | $60,270 | $14,000 | $46,270 |
| 2015 | $2,796 | $60,270 | $14,000 | $46,270 |
| 2014 | $2,794 | $60,270 | $14,000 | $46,270 |
| 2013 | $2,836 | $60,480 | $15,400 | $45,080 |
Source: Public Records
Map
Nearby Homes
- 4172 Brandonmore Dr
- 1797 Muskegon Dr
- 1624 Pinebluff Ln
- 471 Sanctuary Way
- 473 Sanctuary Way
- 475 Sanctuary Way
- 477 Sanctuary Way
- 477 Sanctuary Way Unit 23
- 498 Sanctuary Way
- 496 Sanctuary Way
- 494 Sanctuary Way
- 492 Sanctuary Way
- 490 Sanctuary Way
- 488 Sanctuary Way
- 8557 Linderwood Ln
- 486 Sanctuary Way
- 482 Sanctuary Way
- 8486 Bethany Ln
- 1728 Rockhurst Ln
- 4077 Mclean Dr
- 4189 Brandonmore Dr
- 4185 Brandonmore Dr
- 4191 Brandonmore Dr
- 4183 Brandonmore Dr
- 4188 Brandonmore Dr
- 1666 Muskegon Dr
- 1654 Muskegon Dr
- 4186 Brandonmore Dr
- 1642 Muskegon Dr
- 1642 Muskegon Dr
- 1678 Muskegon Dr
- 4192 Brandonmore Dr
- 4193 Brandonmore Dr
- 4181 Brandonmore Dr
- 4184 Brandonmore Dr
- 1690 Muskegon Dr
- 1702 Muskegon Dr
- 1630 Muskegon Dr
- 4194 Brandonmore Dr
- 440 Maplecroft Ct