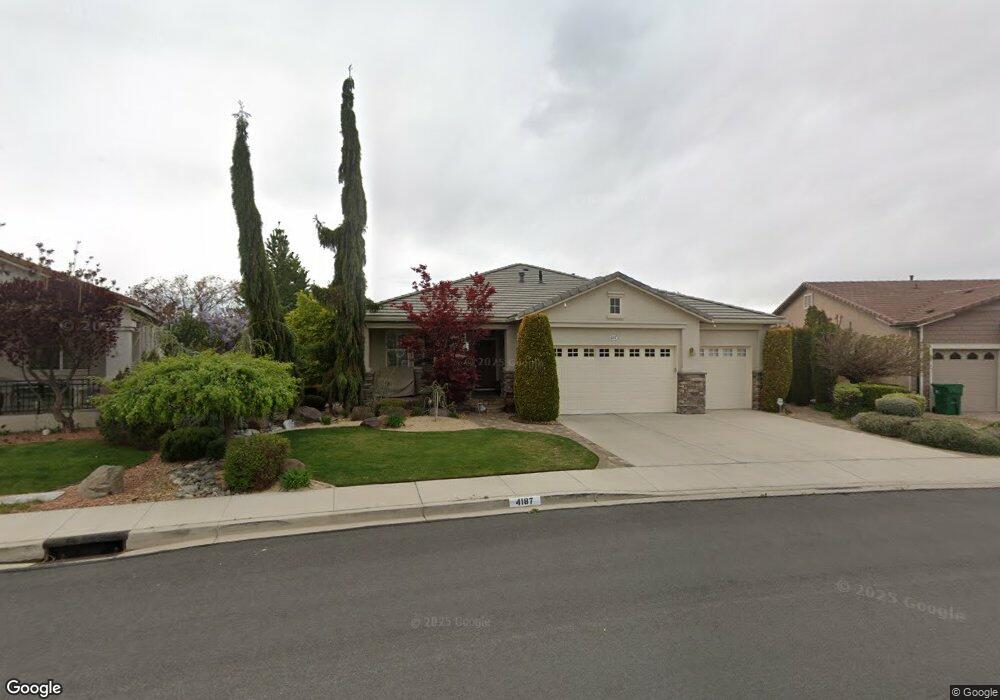
4187 Talladega Dr Sparks, NV 89436
Los Altos Parkway NeighborhoodEstimated Value: $782,000 - $914,000
4
Beds
4
Baths
3,459
Sq Ft
$240/Sq Ft
Est. Value
About This Home
This home is located at 4187 Talladega Dr, Sparks, NV 89436 and is currently estimated at $829,923, approximately $239 per square foot. 4187 Talladega Dr is a home located in Washoe County with nearby schools including Bud Beasley Elementary School, Lou Mendive Middle School, and Edward C Reed High School.
Ownership History
Date
Name
Owned For
Owner Type
Purchase Details
Closed on
Dec 22, 2022
Sold by
Sullivan Brian J and Sullivan Darlyne D
Bought by
Sullivan Living Family Trust
Current Estimated Value
Purchase Details
Closed on
Jun 19, 2006
Sold by
Solomon Gary R and Solomon Phontip
Bought by
Sullivan Brian J and Sullivan Darlyne D
Home Financials for this Owner
Home Financials are based on the most recent Mortgage that was taken out on this home.
Original Mortgage
$536,000
Interest Rate
6.55%
Mortgage Type
Unknown
Purchase Details
Closed on
Mar 31, 2006
Sold by
Weber Marie D
Bought by
Solomon Gary R and Solomon Phontip
Purchase Details
Closed on
May 27, 2005
Sold by
Weber Marie D
Bought by
Weber Marie D and Weber Living Trust
Purchase Details
Closed on
Feb 16, 2005
Sold by
Centex Homes
Bought by
Solomon Gary R and Solomon Phontip
Purchase Details
Closed on
Nov 15, 2004
Sold by
Centex Homes
Bought by
Solomon Gary R and Solomon Phontip
Create a Home Valuation Report for This Property
The Home Valuation Report is an in-depth analysis detailing your home's value as well as a comparison with similar homes in the area
Home Values in the Area
Average Home Value in this Area
Purchase History
| Date | Buyer | Sale Price | Title Company |
|---|---|---|---|
| Sullivan Living Family Trust | -- | -- | |
| Sullivan Brian J | $670,000 | Ticor Title Of Nevada Inc | |
| Solomon Gary R | -- | None Available | |
| Weber Marie D | -- | -- | |
| Solomon Gary R | -- | Commerce Title Company | |
| Solomon Gary R | $580,000 | Commerce Title Company |
Source: Public Records
Mortgage History
| Date | Status | Borrower | Loan Amount |
|---|---|---|---|
| Previous Owner | Sullivan Brian J | $536,000 |
Source: Public Records
Tax History Compared to Growth
Tax History
| Year | Tax Paid | Tax Assessment Tax Assessment Total Assessment is a certain percentage of the fair market value that is determined by local assessors to be the total taxable value of land and additions on the property. | Land | Improvement |
|---|---|---|---|---|
| 2025 | $4,548 | $205,403 | $58,212 | $147,191 |
| 2024 | $4,548 | $201,086 | $52,577 | $148,509 |
| 2023 | $4,416 | $198,069 | $56,252 | $141,817 |
| 2022 | $4,290 | $163,981 | $47,654 | $116,326 |
| 2021 | $4,167 | $156,249 | $40,651 | $115,598 |
| 2020 | $4,045 | $155,530 | $38,367 | $117,163 |
| 2019 | $3,928 | $149,505 | $37,240 | $112,265 |
| 2018 | $3,812 | $137,621 | $27,636 | $109,985 |
| 2017 | $3,703 | $137,586 | $27,636 | $109,950 |
| 2016 | $3,607 | $138,174 | $27,146 | $111,028 |
| 2015 | $3,600 | $123,724 | $22,197 | $101,527 |
| 2014 | $3,492 | $109,116 | $24,255 | $84,861 |
| 2013 | -- | $91,366 | $18,620 | $72,746 |
Source: Public Records
Map
Nearby Homes
- 1850 Almonte Ct
- 4383 Setting Sun Ct Unit 1
- 4393 Acobat Ct
- 2411 Tecumseh Way Unit 12
- 2415 Tecumseh Way
- 2427 Tecumseh Way Unit 8
- 1557 Satellite Dr
- 3324 Danville Dr
- 1475 Golddust Dr
- 1484 Serendipity Ct
- 3221 Myles Dr
- 4675 Firtree Ln
- 2316 Isabella Ct
- 3253 Clan Alpine Dr
- 4601 N Cactus Hills Ct
- 3238 Candelaria Dr
- 1575 Olinghouse St
- 3345 Groom Way
- 1550 Istrice Rd
- 1685 Southview Dr
- 4193 Talladega Dr
- 4181 Talladega Dr
- 4199 Talladega Dr
- 4175 Talladega Dr
- 4205 Talladega Dr
- 4169 Talladega Dr
- 0 Talladega Unit 100005144
- 0 Talladega Unit 120006372
- 0 Talladega Unit 120007452
- 0 Talladega Unit 60024020
- 0 Talladega Unit 50016076
- 4211 Talladega Dr
- 4163 Talladega Dr
- 4157 Talladega Dr
- 4217 Talladega Dr
- 4151 Talladega Dr
- 4223 Talladega Dr
- 4139 Talladega Dr
- 4145 Talladega Dr
- 4229 Talladega Dr