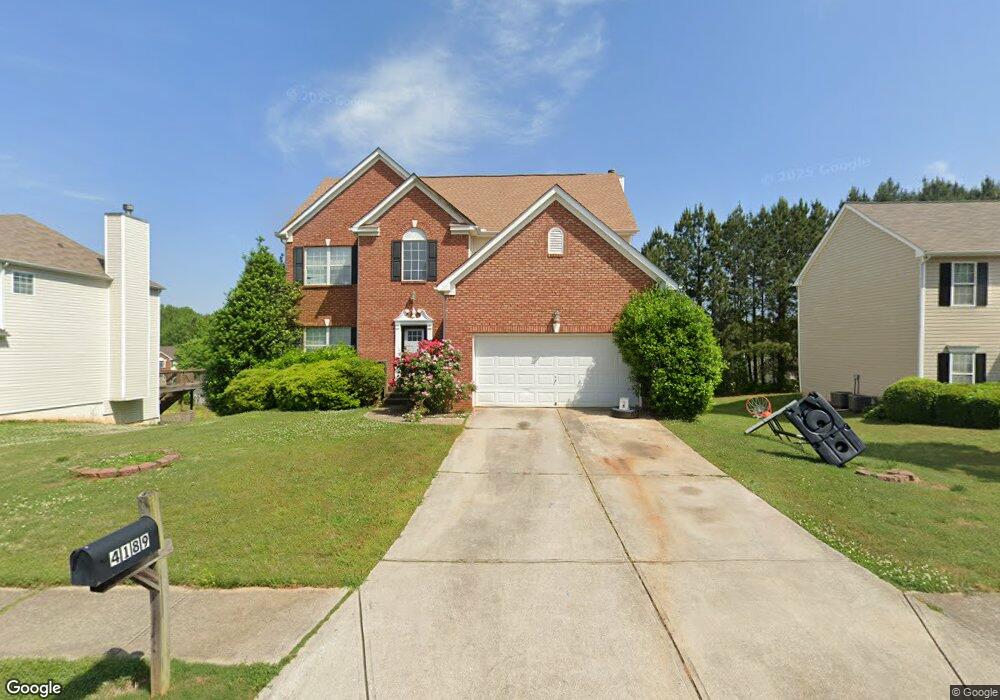
4189 Medlock River Ct Snellville, GA 30039
Estimated Value: $362,036 - $402,000
4
Beds
3
Baths
2,437
Sq Ft
$154/Sq Ft
Est. Value
About This Home
This home is located at 4189 Medlock River Ct, Snellville, GA 30039 and is currently estimated at $376,009, approximately $154 per square foot. 4189 Medlock River Ct is a home located in Gwinnett County with nearby schools including Anderson-Livsey Elementary School, Shiloh Middle School, and Shiloh High School.
Ownership History
Date
Name
Owned For
Owner Type
Purchase Details
Closed on
Feb 7, 2011
Sold by
Secretary Of Veterans Affairs
Bought by
Robinson Rhonda T
Current Estimated Value
Home Financials for this Owner
Home Financials are based on the most recent Mortgage that was taken out on this home.
Original Mortgage
$126,777
Outstanding Balance
$85,043
Interest Rate
4.37%
Mortgage Type
FHA
Estimated Equity
$290,966
Purchase Details
Closed on
Jun 1, 2010
Sold by
Cwab Inc Trust 2005-Sd3
Bought by
Secretary Of Veterans Affairs
Purchase Details
Closed on
Aug 29, 2002
Sold by
Ryland Grp Inc
Bought by
Sheats Lori B
Home Financials for this Owner
Home Financials are based on the most recent Mortgage that was taken out on this home.
Original Mortgage
$191,150
Interest Rate
6.18%
Mortgage Type
VA
Create a Home Valuation Report for This Property
The Home Valuation Report is an in-depth analysis detailing your home's value as well as a comparison with similar homes in the area
Home Values in the Area
Average Home Value in this Area
Purchase History
| Date | Buyer | Sale Price | Title Company |
|---|---|---|---|
| Robinson Rhonda T | $118,500 | -- | |
| Secretary Of Veterans Affairs | -- | -- | |
| Cwab Inc Trust 2005-Sd3 | $114,569 | -- | |
| Sheats Lori B | $188,600 | -- |
Source: Public Records
Mortgage History
| Date | Status | Borrower | Loan Amount |
|---|---|---|---|
| Open | Robinson Rhonda T | $126,777 | |
| Previous Owner | Sheats Lori B | $191,150 |
Source: Public Records
Tax History Compared to Growth
Tax History
| Year | Tax Paid | Tax Assessment Tax Assessment Total Assessment is a certain percentage of the fair market value that is determined by local assessors to be the total taxable value of land and additions on the property. | Land | Improvement |
|---|---|---|---|---|
| 2024 | $4,260 | $154,360 | $30,000 | $124,360 |
| 2023 | $4,260 | $170,480 | $28,000 | $142,480 |
| 2022 | $3,708 | $129,640 | $22,000 | $107,640 |
| 2021 | $2,899 | $88,640 | $14,400 | $74,240 |
| 2020 | $2,918 | $88,640 | $14,400 | $74,240 |
| 2019 | $2,839 | $88,640 | $14,400 | $74,240 |
| 2018 | $2,639 | $79,360 | $14,400 | $64,960 |
| 2016 | $2,309 | $63,200 | $12,000 | $51,200 |
| 2015 | $2,158 | $57,680 | $11,520 | $46,160 |
| 2014 | $2,138 | $56,840 | $8,000 | $48,840 |
Source: Public Records
Map
Nearby Homes
- 4212 Medlock River Ct
- 4357 James Wade Dr
- 4211 Crestside Ridge
- 4311 Marci St
- 4092 Arabian Way
- 4216 Preserve Trail
- 4237 Shoreside Cir Unit 1
- 4107 Round Stone Trail
- 4331 Wrexham Ct
- 4111 Wrexham Dr
- 3909 Laurens Ln
- 5105 Bridle Point Pkwy Unit 4
- 572 Lake Dr
- 5070 Bridle Point Pkwy
- 4341 Horder Ct
- 3897 Valley Bluff Ln
- 4179 Medlock River Ct
- 4199 Medlock River Ct
- 4274 Wood Cove Dr Unit 2
- 4264 Wood Cove Dr Unit 2
- 4169 Medlock River Ct
- 4209 Medlock River Ct
- 4182 Medlock River Ct
- 4202 Medlock River Ct
- 4284 Wood Cove Dr
- 4172 Medlock River Ct Unit 1
- 4159 Medlock River Ct
- 4219 Medlock River Ct Unit 1
- 4244 Wood Cove Dr Unit 2
- 4212 Medlock River Ct Unit 1
- 4248 Medlock Woods Dr Unit II/14
- 4248 Medlock Woods Dr
- 4162 Medlock River Ct Unit 1
- 4218 Medlock Woods Dr
- 4149 Medlock River Ct
- 4222 Medlock River Ct