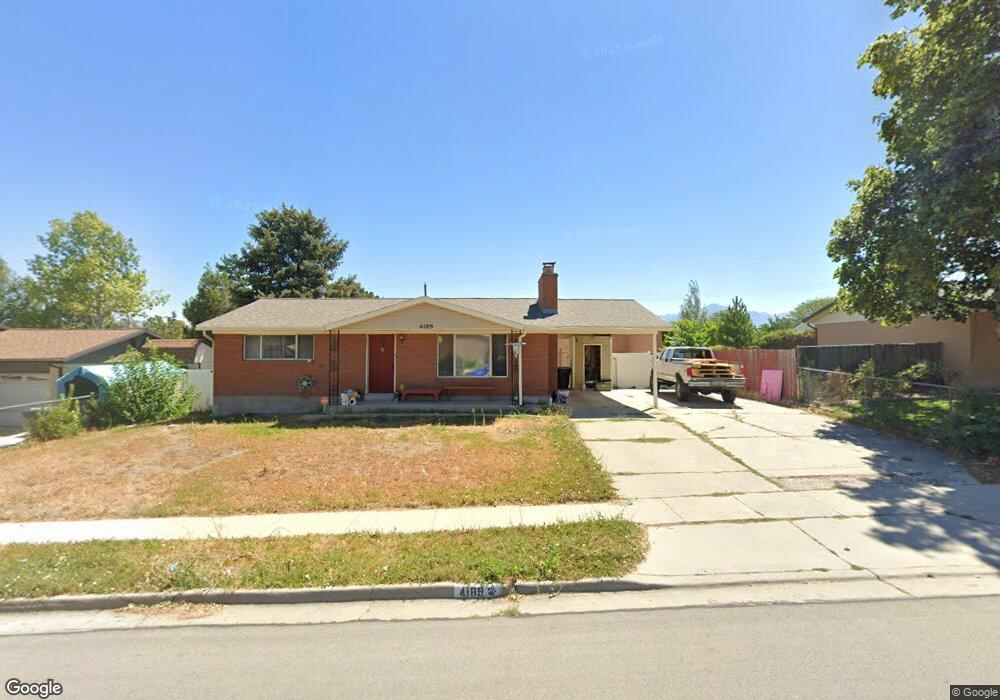
4189 S Deno Dr Salt Lake City, UT 84120
Granger NeighborhoodEstimated Value: $426,000 - $453,000
3
Beds
2
Baths
2,052
Sq Ft
$216/Sq Ft
Est. Value
About This Home
This home is located at 4189 S Deno Dr, Salt Lake City, UT 84120 and is currently estimated at $444,112, approximately $216 per square foot. 4189 S Deno Dr is a home located in Salt Lake County with nearby schools including Philo T Farnsworth Elementary School, Valley Junior High School, and Granger High School.
Ownership History
Date
Name
Owned For
Owner Type
Purchase Details
Closed on
Mar 26, 2014
Sold by
Sloan Maureen L
Bought by
Conrad Brian
Current Estimated Value
Home Financials for this Owner
Home Financials are based on the most recent Mortgage that was taken out on this home.
Original Mortgage
$168,000
Outstanding Balance
$127,277
Interest Rate
4.25%
Mortgage Type
VA
Estimated Equity
$316,835
Purchase Details
Closed on
Dec 30, 1993
Sold by
Sloan Donald M and Sloan Maureen L
Bought by
Sloan Donald M and Sloan Maureen L
Create a Home Valuation Report for This Property
The Home Valuation Report is an in-depth analysis detailing your home's value as well as a comparison with similar homes in the area
Home Values in the Area
Average Home Value in this Area
Purchase History
| Date | Buyer | Sale Price | Title Company |
|---|---|---|---|
| Conrad Brian | -- | Cornerstone Title Ins Agcy L | |
| Sloan Donald M | -- | -- |
Source: Public Records
Mortgage History
| Date | Status | Borrower | Loan Amount |
|---|---|---|---|
| Open | Conrad Brian | $168,000 |
Source: Public Records
Tax History Compared to Growth
Tax History
| Year | Tax Paid | Tax Assessment Tax Assessment Total Assessment is a certain percentage of the fair market value that is determined by local assessors to be the total taxable value of land and additions on the property. | Land | Improvement |
|---|---|---|---|---|
| 2025 | $2,690 | $416,100 | $94,200 | $321,900 |
| 2024 | $2,690 | $412,100 | $93,600 | $318,500 |
| 2023 | $2,495 | $366,000 | $90,000 | $276,000 |
| 2022 | $2,294 | $337,400 | $88,300 | $249,100 |
| 2021 | $2,037 | $269,300 | $67,900 | $201,400 |
| 2020 | $1,881 | $234,700 | $67,900 | $166,800 |
| 2019 | $1,894 | $227,900 | $64,000 | $163,900 |
| 2018 | $0 | $207,300 | $64,000 | $143,300 |
| 2017 | $0 | $207,600 | $64,000 | $143,600 |
| 2016 | $0 | $193,500 | $64,000 | $129,500 |
| 2015 | $1,460 | $164,200 | $79,200 | $85,000 |
| 2014 | $1,354 | $149,200 | $75,000 | $74,200 |
Source: Public Records
Map
Nearby Homes