Estimated Value: $60,000 - $92,000
3
Beds
1
Bath
960
Sq Ft
$82/Sq Ft
Est. Value
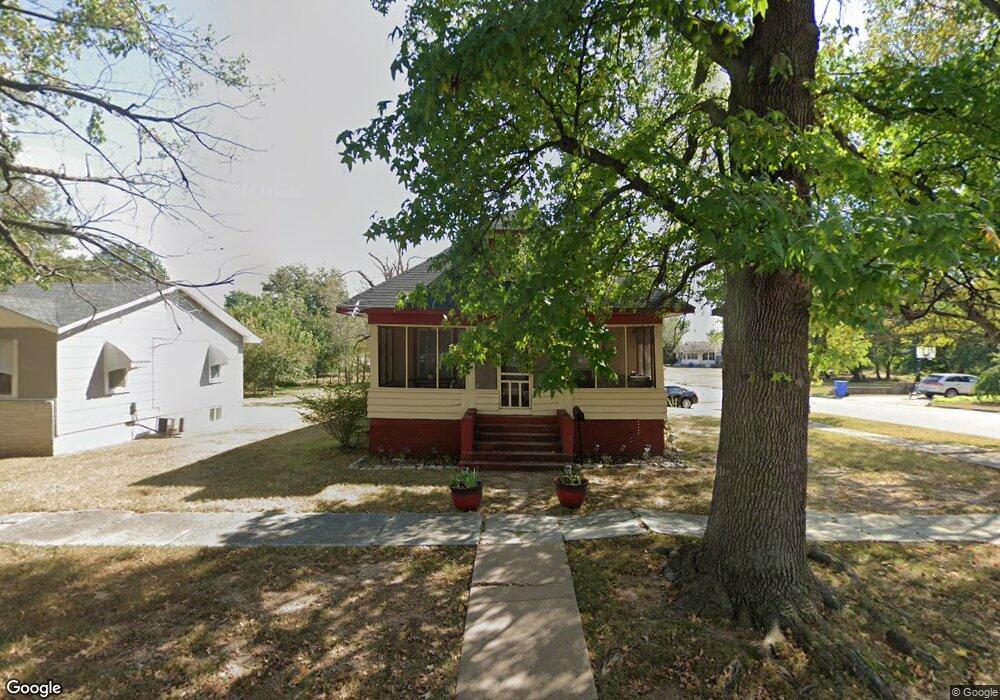
About This Home
This home is located at 419 1st Ave SW, Miami, OK 74354 and is currently estimated at $78,945, approximately $82 per square foot. 419 1st Ave SW is a home located in Ottawa County with nearby schools including Miami High School and Mt. Olive Lutheran School.
Ownership History
Date
Name
Owned For
Owner Type
Purchase Details
Closed on
Jan 24, 2022
Sold by
Flaming and Stephanie
Bought by
Mckenzie Andrew and Rodriguez Tania
Current Estimated Value
Purchase Details
Closed on
Apr 29, 2020
Sold by
Flaming Stephanie and Flaming Jacky
Bought by
Flaming Stephanie and Flaming Jacky
Purchase Details
Closed on
Dec 10, 2019
Sold by
Baker Sandy and Baker Robert
Bought by
Flaming Stephanie
Purchase Details
Closed on
Aug 23, 2019
Sold by
Flaming Jacky and Flaming Stephanie
Bought by
Baker Sandy
Purchase Details
Closed on
Mar 17, 2011
Sold by
Watson Jimmle and Watson Diana
Bought by
Watson Adam and Watson Sharon
Create a Home Valuation Report for This Property
The Home Valuation Report is an in-depth analysis detailing your home's value as well as a comparison with similar homes in the area
Home Values in the Area
Average Home Value in this Area
Purchase History
| Date | Buyer | Sale Price | Title Company |
|---|---|---|---|
| Mckenzie Andrew | $52,500 | None Listed On Document | |
| Flaming Stephanie | $12,000 | None Available | |
| Flaming Stephanie | -- | None Available | |
| Baker Sandy | -- | Oklahoma Ttl & Closing Co In | |
| Watson Adam | $30,000 | None Available |
Source: Public Records
Tax History Compared to Growth
Tax History
| Year | Tax Paid | Tax Assessment Tax Assessment Total Assessment is a certain percentage of the fair market value that is determined by local assessors to be the total taxable value of land and additions on the property. | Land | Improvement |
|---|---|---|---|---|
| 2025 | $566 | $5,985 | $114 | $5,871 |
| 2024 | $566 | $5,871 | $114 | $5,757 |
| 2023 | $566 | $5,358 | $456 | $4,902 |
| 2022 | $122 | $1,319 | $294 | $1,025 |
| 2021 | $119 | $1,257 | $286 | $971 |
| 2020 | $114 | $1,197 | $278 | $919 |
| 2019 | $94 | $1,140 | $266 | $874 |
| 2018 | $257 | $4,104 | $456 | $3,648 |
| 2017 | $251 | $3,985 | $456 | $3,529 |
| 2016 | $230 | $3,868 | $456 | $3,412 |
| 2015 | $81 | $909 | $344 | $565 |
| 2014 | $226 | $3,756 | $456 | $3,300 |
Source: Public Records
Map
Nearby Homes