Estimated Value: $285,666 - $319,000
3
Beds
2
Baths
2,142
Sq Ft
$143/Sq Ft
Est. Value
About This Home
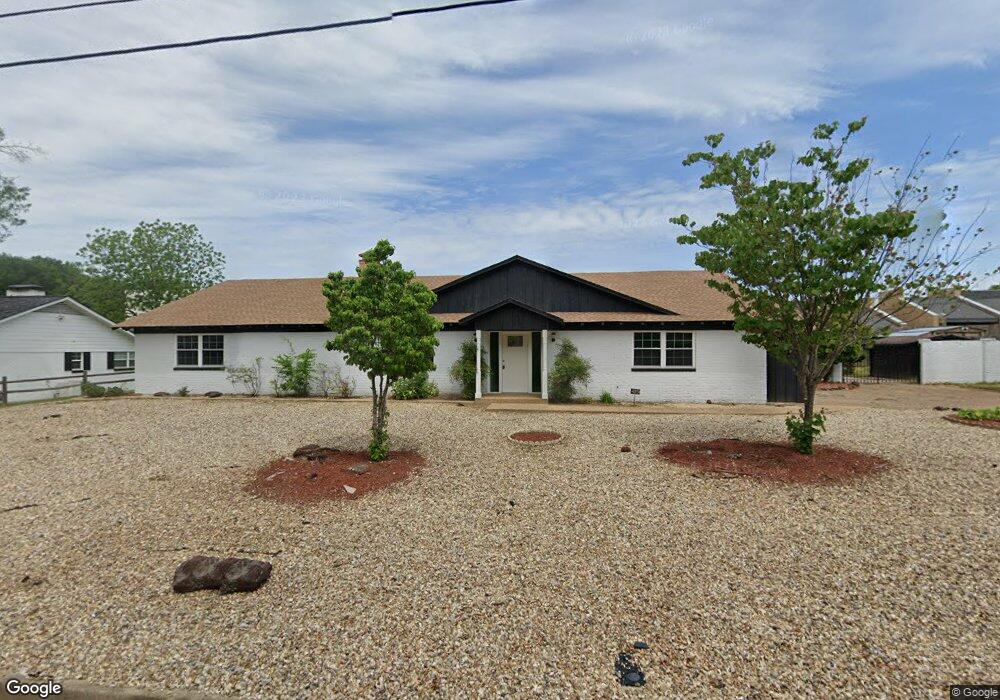
This home is located at 419 419 Holiday Ln, Tyler, TX 75703 and is currently estimated at $305,667, approximately $142 per square foot. 419 419 Holiday Ln is a home located in Smith County with nearby schools including Rice Elementary School, Hubbard Middle School, and Tyler Legacy High School.
Ownership History
Date
Name
Owned For
Owner Type
Purchase Details
Closed on
Sep 13, 2022
Sold by
J & L Stevens Enterprises Llc
Bought by
Chen Shun and Chen Christina Nathalia
Current Estimated Value
Home Financials for this Owner
Home Financials are based on the most recent Mortgage that was taken out on this home.
Original Mortgage
$209,700
Outstanding Balance
$199,349
Interest Rate
5%
Mortgage Type
New Conventional
Estimated Equity
$106,318
Purchase Details
Closed on
Aug 9, 2022
Sold by
Pickett Robert Jewell
Bought by
J & L Stevens Enterprises Inc
Home Financials for this Owner
Home Financials are based on the most recent Mortgage that was taken out on this home.
Original Mortgage
$209,700
Outstanding Balance
$199,349
Interest Rate
5%
Mortgage Type
New Conventional
Estimated Equity
$106,318
Purchase Details
Closed on
Feb 20, 2007
Sold by
Pickett Rhodora Valentin
Bought by
Pickett Robert Jewell
Create a Home Valuation Report for This Property
The Home Valuation Report is an in-depth analysis detailing your home's value as well as a comparison with similar homes in the area
Home Values in the Area
Average Home Value in this Area
Purchase History
| Date | Buyer | Sale Price | Title Company |
|---|---|---|---|
| Chen Shun | -- | -- | |
| J & L Stevens Enterprises Inc | -- | None Listed On Document | |
| Pickett Robert Jewell | -- | None Available |
Source: Public Records
Mortgage History
| Date | Status | Borrower | Loan Amount |
|---|---|---|---|
| Open | Chen Shun | $209,700 |
Source: Public Records
Tax History Compared to Growth
Tax History
| Year | Tax Paid | Tax Assessment Tax Assessment Total Assessment is a certain percentage of the fair market value that is determined by local assessors to be the total taxable value of land and additions on the property. | Land | Improvement |
|---|---|---|---|---|
| 2025 | $4,650 | $273,705 | $54,947 | $218,758 |
| 2024 | $4,650 | $273,358 | $31,856 | $241,502 |
| 2023 | $5,082 | $291,509 | $31,856 | $259,653 |
| 2022 | $3,062 | $248,860 | $29,268 | $219,592 |
| 2021 | $2,981 | $142,089 | $29,268 | $112,821 |
| 2020 | $3,000 | $142,964 | $29,268 | $113,696 |
| 2019 | $2,787 | $127,459 | $19,910 | $107,549 |
| 2018 | $2,712 | $124,672 | $19,910 | $104,762 |
| 2017 | $2,662 | $124,672 | $19,910 | $104,762 |
| 2016 | $2,530 | $118,495 | $19,910 | $98,585 |
| 2015 | $1,848 | $118,554 | $19,910 | $98,644 |
| 2014 | $1,848 | $115,333 | $19,910 | $95,423 |
Source: Public Records
Map
Nearby Homes
- 429 Holiday Ln
- 418 Boyd Ln
- 7434 Waterview Square
- 6052 N Park Central Ct
- 410 Brighton Ct
- 504 Woodland Hills Dr
- 604-606 Woodland Hills Dr
- 11948 Gillian Ct
- 3617 Jill Cir
- 701 Woodland Hills Dr
- 612 Rosemont Place II
- 815 Woodland Hills Dr
- 704 Paloma St
- 5106 Cloverdale Dr
- 601 Carriage Dr
- 14237 County Road 192
- 14195 County Road 192
- 14245 County Road 192
- 3606 Glendale Dr
- 3829 Cloverdale Dr
- 419 Holiday Ln
- 4411 Old Bullard Rd
- 409 Holiday Ln
- 418 Holiday Ln
- 428 428 Holiday Ln
- 428 Holiday Ln
- 408 Holiday Ln
- 4524 Leisure Ln
- 4505 Leisure Ln
- 4515 Leisure Ln
- 417 Boyd Ln
- 4525 Leisure Ln
- 4600 4600 Leisure
- 4600 Leisure Ln
- 411 Boyd Ln
- 411 411 Boyd Ln
- 4510 Richmond Rd
- 4500 Richmond Rd
- 4601 Leisure Ln
- 4520 Richmond Rd