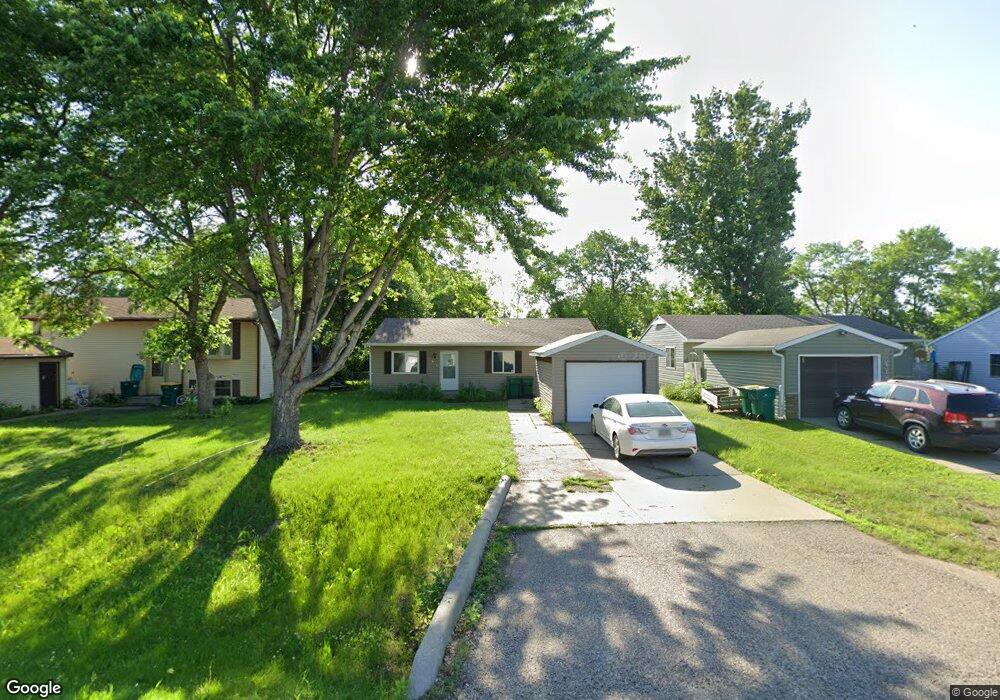
419 5th Ave N Mapleton, ND 58059
Estimated Value: $253,000 - $272,000
3
Beds
1
Bath
2,080
Sq Ft
$126/Sq Ft
Est. Value
About This Home
This home is located at 419 5th Ave N, Mapleton, ND 58059 and is currently estimated at $262,868, approximately $126 per square foot. 419 5th Ave N is a home located in Cass County with nearby schools including Mapleton Elementary School.
Ownership History
Date
Name
Owned For
Owner Type
Purchase Details
Closed on
Oct 14, 2016
Sold by
Bachmeier Christopher and Bachmeier Tiffany
Bought by
Haug Erik D
Current Estimated Value
Home Financials for this Owner
Home Financials are based on the most recent Mortgage that was taken out on this home.
Original Mortgage
$114,400
Outstanding Balance
$91,713
Interest Rate
3.46%
Mortgage Type
New Conventional
Estimated Equity
$171,155
Purchase Details
Closed on
Oct 14, 2005
Sold by
Eid Richard and Eid Carmen E
Bought by
Bachmeier Christopher
Home Financials for this Owner
Home Financials are based on the most recent Mortgage that was taken out on this home.
Original Mortgage
$90,204
Interest Rate
5.82%
Mortgage Type
New Conventional
Create a Home Valuation Report for This Property
The Home Valuation Report is an in-depth analysis detailing your home's value as well as a comparison with similar homes in the area
Purchase History
| Date | Buyer | Sale Price | Title Company |
|---|---|---|---|
| Haug Erik D | $143,000 | Title Co | |
| Bachmeier Christopher | -- | -- |
Source: Public Records
Mortgage History
| Date | Status | Borrower | Loan Amount |
|---|---|---|---|
| Open | Haug Erik D | $114,400 | |
| Previous Owner | Bachmeier Christopher | $90,204 |
Source: Public Records
Tax History
| Year | Tax Paid | Tax Assessment Tax Assessment Total Assessment is a certain percentage of the fair market value that is determined by local assessors to be the total taxable value of land and additions on the property. | Land | Improvement |
|---|---|---|---|---|
| 2024 | $3,273 | $106,300 | $14,800 | $91,500 |
| 2023 | $3,161 | $104,000 | $14,800 | $89,200 |
| 2022 | $2,743 | $95,250 | $14,800 | $80,450 |
| 2021 | $2,598 | $86,600 | $11,450 | $75,150 |
| 2020 | $2,462 | $83,250 | $11,450 | $71,800 |
| 2019 | $2,463 | $83,250 | $11,450 | $71,800 |
| 2018 | $2,473 | $82,550 | $11,450 | $71,100 |
| 2017 | $2,334 | $81,000 | $11,450 | $69,550 |
| 2016 | $1,228 | $58,550 | $7,150 | $51,400 |
| 2015 | $1,089 | $54,200 | $6,600 | $47,600 |
| 2014 | $1,070 | $49,250 | $6,000 | $43,250 |
| 2013 | $1,185 | $49,250 | $6,000 | $43,250 |
Source: Public Records
Map
Nearby Homes
Your Personal Tour Guide
Ask me questions while you tour the home.