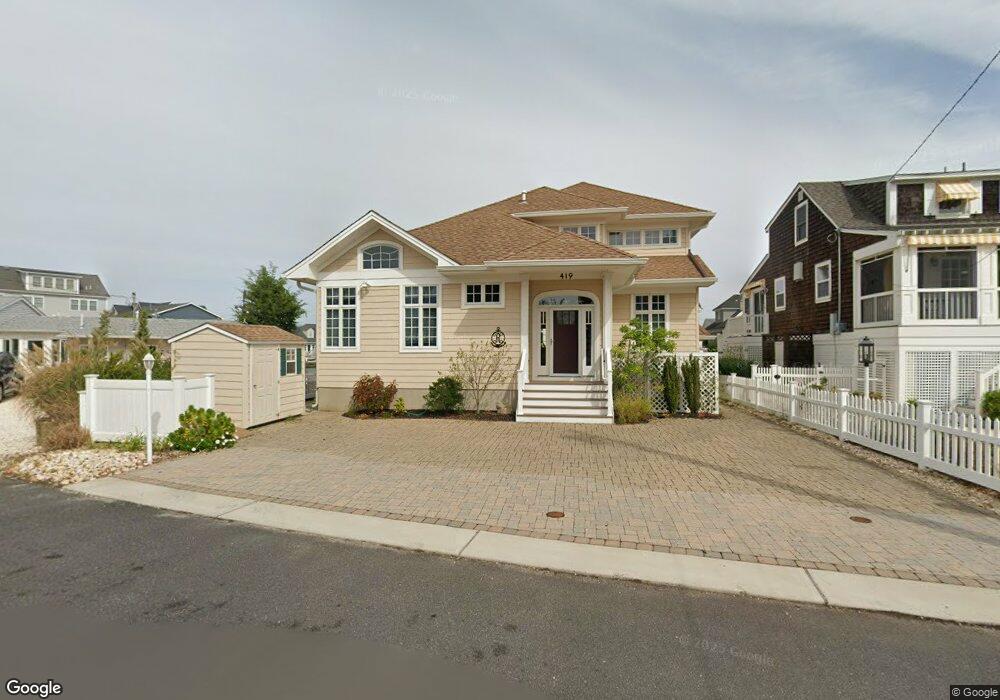
419 7th Ave Mantoloking, NJ 08738
Estimated Value: $1,674,000 - $2,240,000
3
Beds
3
Baths
2,357
Sq Ft
$840/Sq Ft
Est. Value
About This Home
This home is located at 419 7th Ave, Mantoloking, NJ 08738 and is currently estimated at $1,980,014, approximately $840 per square foot. 419 7th Ave is a home located in Ocean County with nearby schools including Emma Havens Young Elementary School, Lake Riviera Middle School, and Brick Township High School.
Ownership History
Date
Name
Owned For
Owner Type
Purchase Details
Closed on
Jun 21, 2019
Sold by
Hmpsh Llc
Bought by
Rynar Robert Alan and Rynar Irene Mary
Current Estimated Value
Home Financials for this Owner
Home Financials are based on the most recent Mortgage that was taken out on this home.
Original Mortgage
$400,000
Outstanding Balance
$306,501
Interest Rate
3.9%
Mortgage Type
New Conventional
Estimated Equity
$1,673,513
Purchase Details
Closed on
May 23, 2012
Sold by
Thompson Scott A and Thompson Christopher R
Bought by
Hmpsh Llc
Purchase Details
Closed on
Apr 15, 2011
Sold by
Thompson Scott A and Thompson Christopher R
Bought by
Hmpsh Llc
Purchase Details
Closed on
Nov 4, 2009
Sold by
Estate Of Neal C Thompson
Bought by
Thompson Scott A and Thompson Christopher R
Purchase Details
Closed on
Sep 21, 2009
Sold by
Neal C Thompson Qualified Personal Resid
Bought by
Estate Of Neal C Thompson
Purchase Details
Closed on
Oct 1, 1996
Sold by
Klein Sanford Stanley
Bought by
Thompson Neal and Thompson Dorinda
Home Financials for this Owner
Home Financials are based on the most recent Mortgage that was taken out on this home.
Original Mortgage
$221,000
Interest Rate
8.06%
Create a Home Valuation Report for This Property
The Home Valuation Report is an in-depth analysis detailing your home's value as well as a comparison with similar homes in the area
Home Values in the Area
Average Home Value in this Area
Purchase History
| Date | Buyer | Sale Price | Title Company |
|---|---|---|---|
| Rynar Robert Alan | $1,062,000 | Old Republic Title | |
| Hmpsh Llc | -- | None Available | |
| Hmpsh Llc | -- | None Available | |
| Thompson Scott A | -- | None Available | |
| Estate Of Neal C Thompson | -- | None Available | |
| Thompson Neal | $277,000 | -- |
Source: Public Records
Mortgage History
| Date | Status | Borrower | Loan Amount |
|---|---|---|---|
| Open | Rynar Robert Alan | $400,000 | |
| Previous Owner | Thompson Neal | $221,000 |
Source: Public Records
Tax History
| Year | Tax Paid | Tax Assessment Tax Assessment Total Assessment is a certain percentage of the fair market value that is determined by local assessors to be the total taxable value of land and additions on the property. | Land | Improvement |
|---|---|---|---|---|
| 2025 | $22,054 | $812,600 | $515,700 | $296,900 |
| 2024 | $19,949 | $812,600 | $515,700 | $296,900 |
| 2023 | $19,476 | $803,800 | $515,700 | $288,100 |
| 2022 | $19,476 | $803,800 | $515,700 | $288,100 |
| 2021 | $19,066 | $803,800 | $515,700 | $288,100 |
| 2020 | $18,670 | $797,200 | $509,400 | $287,800 |
| 2019 | $18,360 | $797,200 | $509,400 | $287,800 |
| 2018 | $17,937 | $797,200 | $509,400 | $287,800 |
| 2017 | $17,451 | $797,200 | $509,400 | $287,800 |
| 2016 | $17,363 | $797,200 | $509,400 | $287,800 |
| 2015 | $16,909 | $797,200 | $509,400 | $287,800 |
| 2014 | $16,773 | $710,900 | $509,400 | $201,500 |
Source: Public Records
Map
Nearby Homes
- 499 Ellison Dr
- 254 Harbor Ct
- 201 5th Ave
- 515 New Jersey 35
- 545 New Jersey 35
- 100 3rd Ave
- 112 Neptune Ct
- 438 Route 35 N Unit 2104
- 438 Route 35 N Unit 3201
- 438 Highway 35 N Unit 1202
- 417 Delray Dr
- 459 Boca Raton Dr
- 366 Highway 35 N
- 170 W Beach Way
- 348 Venice Dr
- 155 W Atlantic Way
- 359 Naples Ct
- 354 Naples Ct
- 109 W Tarpon Way
- 327 Tide Pond Rd
Your Personal Tour Guide
Ask me questions while you tour the home.