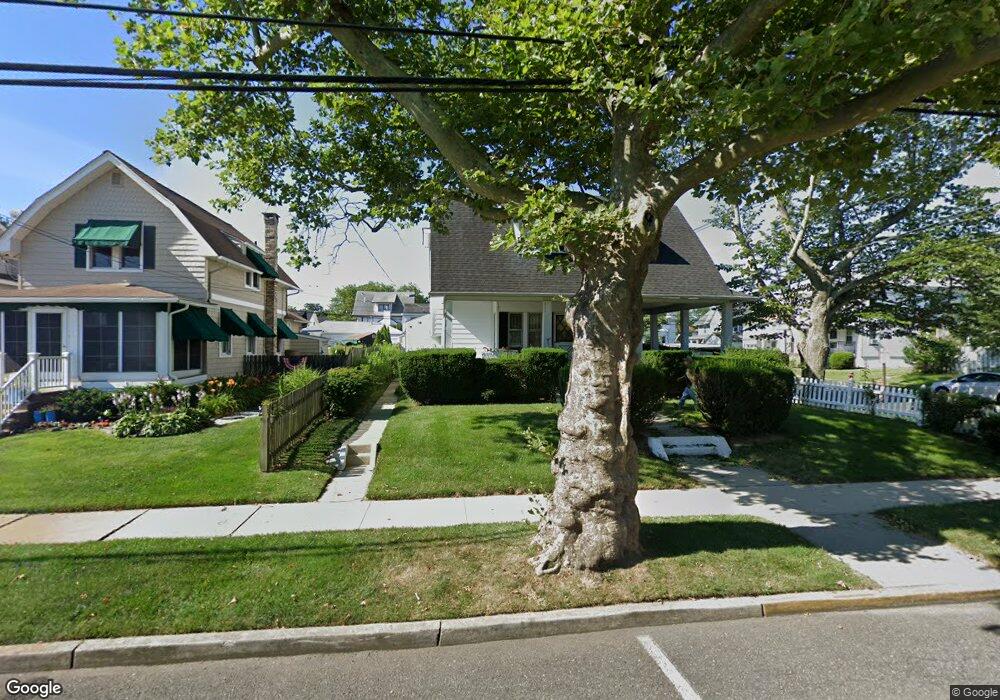
419 9th Ave Belmar, NJ 07719
Estimated Value: $1,222,000 - $1,672,000
3
Beds
3
Baths
1,658
Sq Ft
$857/Sq Ft
Est. Value
About This Home
This home is located at 419 9th Ave, Belmar, NJ 07719 and is currently estimated at $1,420,633, approximately $856 per square foot. 419 9th Ave is a home located in Monmouth County with nearby schools including Belmar Elementary School, St. Rose Grammar School, and St Rose High School.
Ownership History
Date
Name
Owned For
Owner Type
Purchase Details
Closed on
Dec 7, 2018
Sold by
Brand Donald E and Brand Family Trust
Bought by
419 Ninth Avenue Belmar Llc
Current Estimated Value
Purchase Details
Closed on
Oct 27, 1998
Sold by
Brand Ursula
Bought by
Brand Donald
Purchase Details
Closed on
Sep 29, 1998
Sold by
Brand Ursula
Bought by
Brand Donald
Purchase Details
Closed on
Jul 22, 1998
Sold by
Brand Ursula
Bought by
Brand Donald
Create a Home Valuation Report for This Property
The Home Valuation Report is an in-depth analysis detailing your home's value as well as a comparison with similar homes in the area
Home Values in the Area
Average Home Value in this Area
Purchase History
| Date | Buyer | Sale Price | Title Company |
|---|---|---|---|
| 419 Ninth Avenue Belmar Llc | -- | None Available | |
| Brand Donald | $3,500 | -- | |
| Brand Donald | $4,000 | -- | |
| Brand Donald | $19,150 | -- |
Source: Public Records
Tax History Compared to Growth
Tax History
| Year | Tax Paid | Tax Assessment Tax Assessment Total Assessment is a certain percentage of the fair market value that is determined by local assessors to be the total taxable value of land and additions on the property. | Land | Improvement |
|---|---|---|---|---|
| 2025 | $10,659 | $732,600 | $500,000 | $232,600 |
| 2024 | $10,300 | $732,600 | $500,000 | $232,600 |
| 2023 | $10,300 | $732,600 | $500,000 | $232,600 |
| 2022 | $9,941 | $732,600 | $500,000 | $232,600 |
| 2021 | $9,941 | $732,600 | $500,000 | $232,600 |
| 2020 | $9,853 | $732,600 | $500,000 | $232,600 |
| 2019 | $9,853 | $732,600 | $500,000 | $232,600 |
| 2018 | $9,048 | $732,600 | $500,000 | $232,600 |
| 2017 | $8,828 | $732,600 | $500,000 | $232,600 |
| 2016 | $10,436 | $546,100 | $260,000 | $286,100 |
| 2015 | $10,096 | $526,100 | $240,000 | $286,100 |
| 2014 | $9,793 | $506,100 | $220,000 | $286,100 |
Source: Public Records
Map
Nearby Homes