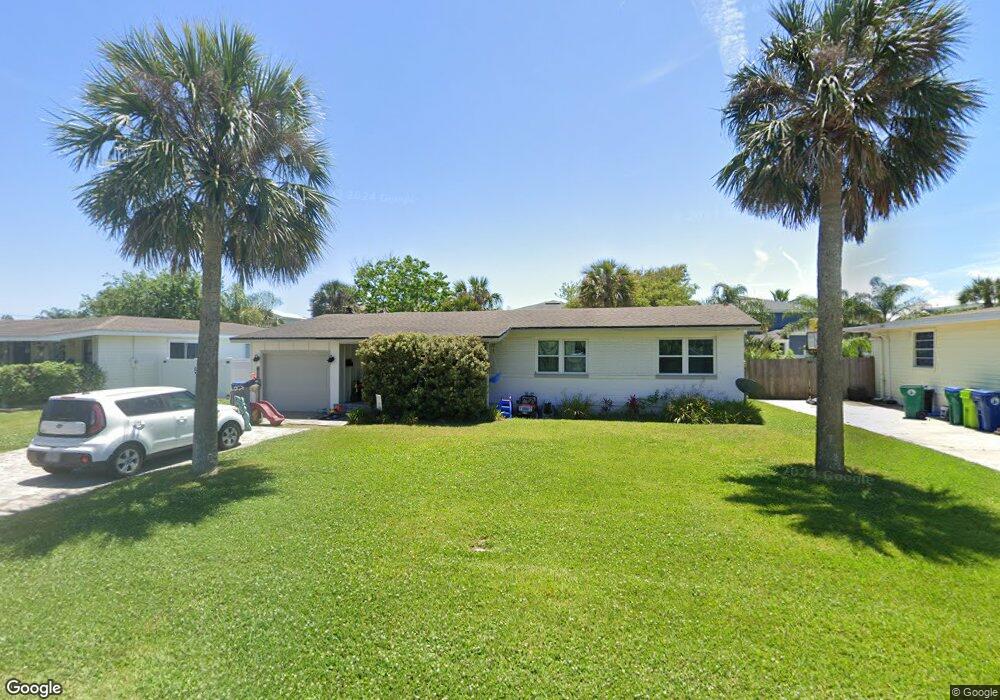
419 Bowles St Neptune Beach, FL 32266
Estimated Value: $726,000 - $802,038
4
Beds
2
Baths
1,531
Sq Ft
$499/Sq Ft
Est. Value
About This Home
This home is located at 419 Bowles St, Neptune Beach, FL 32266 and is currently estimated at $763,760, approximately $498 per square foot. 419 Bowles St is a home located in Duval County with nearby schools including Neptune Beach Elementary School, Duncan U. Fletcher Middle School, and Duncan U. Fletcher High School.
Ownership History
Date
Name
Owned For
Owner Type
Purchase Details
Closed on
Aug 23, 2013
Sold by
Massey Hugh M and Massey Dorothy S
Bought by
Blanchard Jonathan M
Current Estimated Value
Home Financials for this Owner
Home Financials are based on the most recent Mortgage that was taken out on this home.
Original Mortgage
$274,783
Outstanding Balance
$204,346
Interest Rate
4.39%
Mortgage Type
VA
Estimated Equity
$559,414
Purchase Details
Closed on
May 8, 2008
Sold by
Massey Hugh and Massey Marilyn M
Bought by
Massey Hugh M and Massey Dorothy S
Create a Home Valuation Report for This Property
The Home Valuation Report is an in-depth analysis detailing your home's value as well as a comparison with similar homes in the area
Home Values in the Area
Average Home Value in this Area
Purchase History
| Date | Buyer | Sale Price | Title Company |
|---|---|---|---|
| Blanchard Jonathan M | $269,000 | Marsh Landing Title Llc | |
| Massey Hugh M | -- | Attorney |
Source: Public Records
Mortgage History
| Date | Status | Borrower | Loan Amount |
|---|---|---|---|
| Open | Blanchard Jonathan M | $274,783 |
Source: Public Records
Tax History Compared to Growth
Tax History
| Year | Tax Paid | Tax Assessment Tax Assessment Total Assessment is a certain percentage of the fair market value that is determined by local assessors to be the total taxable value of land and additions on the property. | Land | Improvement |
|---|---|---|---|---|
| 2025 | $10,764 | $599,740 | $427,676 | $172,064 |
| 2024 | $11,229 | $599,990 | $414,720 | $185,270 |
| 2023 | $11,229 | $622,768 | $428,544 | $194,224 |
| 2022 | $4,851 | $325,577 | $0 | $0 |
| 2021 | $4,822 | $316,095 | $0 | $0 |
| 2020 | $4,776 | $311,731 | $0 | $0 |
| 2019 | $4,724 | $304,723 | $0 | $0 |
| 2018 | $5,549 | $329,894 | $207,360 | $122,534 |
| 2017 | $4,895 | $267,421 | $138,240 | $129,181 |
| 2016 | $3,073 | $205,745 | $0 | $0 |
| 2015 | $3,105 | $204,315 | $0 | $0 |
| 2014 | $3,110 | $202,694 | $0 | $0 |
Source: Public Records
Map
Nearby Homes