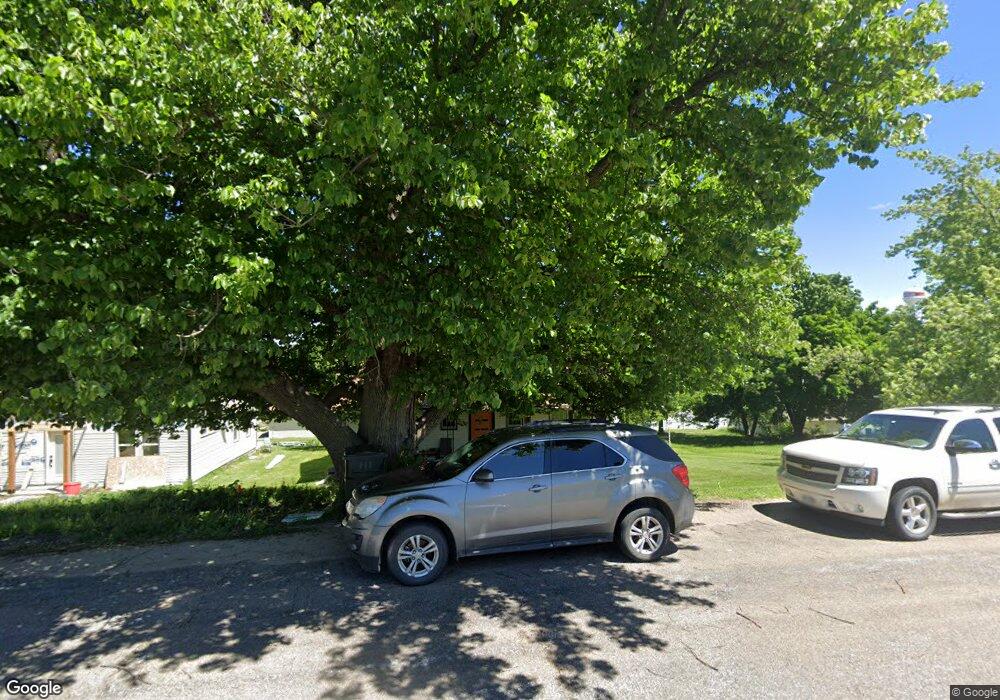
419 Cherry St Clarkson, NE 68629
Estimated Value: $105,024 - $135,000
2
Beds
1
Bath
951
Sq Ft
$132/Sq Ft
Est. Value
About This Home
This home is located at 419 Cherry St, Clarkson, NE 68629 and is currently estimated at $125,256, approximately $131 per square foot. 419 Cherry St is a home located in Colfax County with nearby schools including Clarkson Elementary School, Clarkson Junior/Senior High School, and St John Neumann Catholic Elementary School.
Ownership History
Date
Name
Owned For
Owner Type
Purchase Details
Closed on
Sep 19, 2023
Sold by
Novotny Casey Lynn and Novotny Rodney
Bought by
Ross Hannah M and Ross Tyler J
Current Estimated Value
Purchase Details
Closed on
Jun 4, 2010
Sold by
Doernemann Jarett L and Doernemann Kathleen A
Bought by
Mundil Richard L
Home Financials for this Owner
Home Financials are based on the most recent Mortgage that was taken out on this home.
Original Mortgage
$15,200
Interest Rate
5%
Mortgage Type
New Conventional
Create a Home Valuation Report for This Property
The Home Valuation Report is an in-depth analysis detailing your home's value as well as a comparison with similar homes in the area
Purchase History
| Date | Buyer | Sale Price | Title Company |
|---|---|---|---|
| Ross Hannah M | -- | None Listed On Document | |
| Mundil Richard L | $19,000 | -- |
Source: Public Records
Mortgage History
| Date | Status | Borrower | Loan Amount |
|---|---|---|---|
| Previous Owner | Mundil Richard L | $15,200 |
Source: Public Records
Tax History
| Year | Tax Paid | Tax Assessment Tax Assessment Total Assessment is a certain percentage of the fair market value that is determined by local assessors to be the total taxable value of land and additions on the property. | Land | Improvement |
|---|---|---|---|---|
| 2025 | $879 | $61,570 | $2,100 | $59,470 |
| 2024 | $729 | $60,415 | $2,100 | $58,315 |
| 2023 | $729 | $48,045 | $2,100 | $45,945 |
| 2022 | $679 | $42,535 | $2,100 | $40,435 |
| 2021 | $577 | $35,880 | $2,100 | $33,780 |
| 2020 | $580 | $35,880 | $2,100 | $33,780 |
| 2019 | $567 | $35,460 | $1,680 | $33,780 |
| 2018 | $590 | $36,630 | $1,680 | $34,950 |
| 2017 | $508 | $30,930 | $1,680 | $29,250 |
| 2016 | $506 | $30,930 | $1,680 | $29,250 |
| 2015 | $515 | $30,930 | $1,680 | $29,250 |
| 2014 | $680 | $34,565 | $1,680 | $32,885 |
Source: Public Records
Map
Nearby Homes
Your Personal Tour Guide
Ask me questions while you tour the home.