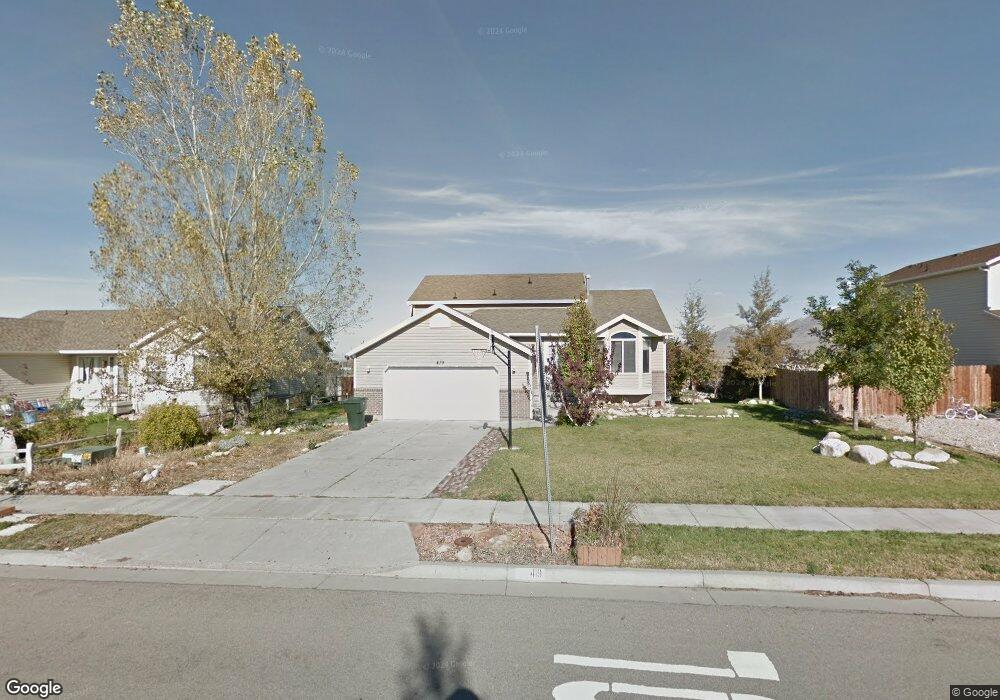
419 E 1480 N Tooele, UT 84074
Estimated Value: $450,162 - $485,000
4
Beds
3
Baths
2,174
Sq Ft
$214/Sq Ft
Est. Value
About This Home
This home is located at 419 E 1480 N, Tooele, UT 84074 and is currently estimated at $464,291, approximately $213 per square foot. 419 E 1480 N is a home located in Tooele County with nearby schools including Copper Canyon Elementary School, Clarke N. Johnsen Junior High School, and Stansbury High School.
Ownership History
Date
Name
Owned For
Owner Type
Purchase Details
Closed on
Oct 5, 2009
Sold by
Isom Thomas G and Isom Kristin
Bought by
Lehnig Jason S and Lehnig Stephanie R
Current Estimated Value
Home Financials for this Owner
Home Financials are based on the most recent Mortgage that was taken out on this home.
Original Mortgage
$183,600
Outstanding Balance
$120,255
Interest Rate
5.14%
Mortgage Type
New Conventional
Estimated Equity
$344,036
Create a Home Valuation Report for This Property
The Home Valuation Report is an in-depth analysis detailing your home's value as well as a comparison with similar homes in the area
Purchase History
| Date | Buyer | Sale Price | Title Company |
|---|---|---|---|
| Lehnig Jason S | -- | Secuority Title Insurance A |
Source: Public Records
Mortgage History
| Date | Status | Borrower | Loan Amount |
|---|---|---|---|
| Open | Lehnig Jason S | $183,600 |
Source: Public Records
Tax History
| Year | Tax Paid | Tax Assessment Tax Assessment Total Assessment is a certain percentage of the fair market value that is determined by local assessors to be the total taxable value of land and additions on the property. | Land | Improvement |
|---|---|---|---|---|
| 2025 | $3,117 | $472,763 | $105,000 | $367,763 |
| 2024 | $3,303 | $252,097 | $57,750 | $194,347 |
| 2023 | $3,303 | $203,406 | $54,996 | $148,410 |
| 2022 | $2,879 | $247,682 | $55,000 | $192,682 |
| 2021 | $2,365 | $170,217 | $22,000 | $148,217 |
| 2020 | $2,265 | $282,779 | $40,000 | $242,779 |
| 2019 | $2,123 | $260,708 | $40,000 | $220,708 |
| 2018 | $1,950 | $227,041 | $40,000 | $187,041 |
| 2017 | $1,678 | $231,781 | $30,000 | $201,781 |
| 2016 | $1,365 | $113,004 | $16,500 | $96,504 |
| 2015 | $1,365 | $99,281 | $0 | $0 |
| 2014 | -- | $99,281 | $0 | $0 |
Source: Public Records
Map
Nearby Homes
- 438 E 1480 N
- 472 E 1420 N
- 1451 N 380 E
- 475 E 1310 N
- 405 E 1310 N
- 1154 N Berra Blvd
- 1598 N 210 E Unit 107
- 1721 Copper Canyon Dr Unit 1282
- 1741 Copper Canyon Dr Unit 1288
- 1735 Copper Canyon Dr Unit 1286
- 1725 Copper Canyon Dr Unit 1283
- 1618 N 210 E
- 1833 N Blue Iris Ave Unit 1073
- 1770 N Patchwork Ave Unit 1255
- 1756 N Patchwork Ave Unit 1258
- 1727 N Patchwork Ave Unit 1268
- 1747 N Patchwork Ave Unit 1264
- 1774 N Patchwork Ave Unit 1254
- 1743 N Patchwork Ave Unit 1265
- 1713 N Patchwork Ave Unit 1271
Your Personal Tour Guide
Ask me questions while you tour the home.