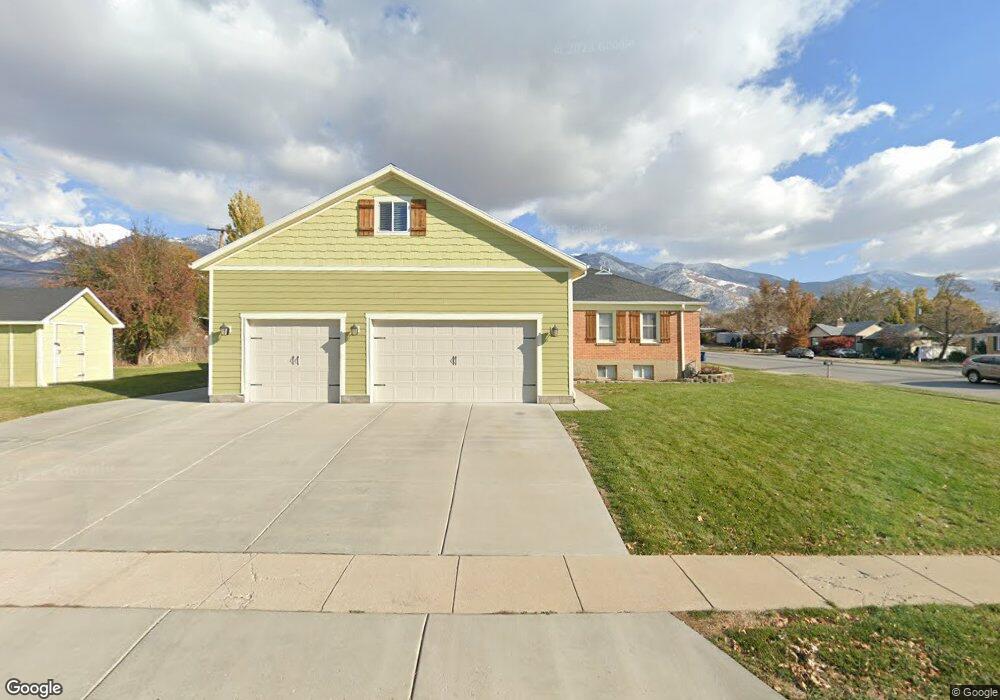
419 E 200 N Kaysville, UT 84037
Estimated Value: $494,000 - $707,000
4
Beds
1
Bath
1,920
Sq Ft
$321/Sq Ft
Est. Value
About This Home
This home is located at 419 E 200 N, Kaysville, UT 84037 and is currently estimated at $617,177, approximately $321 per square foot. 419 E 200 N is a home located in Davis County with nearby schools including Kaysville Elementary School, Kaysville Junior High School, and Davis High School.
Ownership History
Date
Name
Owned For
Owner Type
Purchase Details
Closed on
Jan 10, 2018
Sold by
Brockman Blaine H and Brockman Darcey N
Bought by
Brockman Blaine H and Brockman Revocable Trust
Current Estimated Value
Purchase Details
Closed on
Sep 18, 1999
Sold by
Wilde Cliffton Wa and Wilde Sherrie L
Bought by
Brockman Blaine H and Brockman Darcey N
Home Financials for this Owner
Home Financials are based on the most recent Mortgage that was taken out on this home.
Original Mortgage
$124,387
Interest Rate
8.09%
Mortgage Type
FHA
Purchase Details
Closed on
Feb 25, 1997
Sold by
Rosner Warren M and Rosner Jeannette D
Bought by
Wilde Cliffton W and Wilde Sherrie L
Home Financials for this Owner
Home Financials are based on the most recent Mortgage that was taken out on this home.
Original Mortgage
$105,215
Interest Rate
7.86%
Mortgage Type
FHA
Create a Home Valuation Report for This Property
The Home Valuation Report is an in-depth analysis detailing your home's value as well as a comparison with similar homes in the area
Home Values in the Area
Average Home Value in this Area
Purchase History
| Date | Buyer | Sale Price | Title Company |
|---|---|---|---|
| Brockman Blaine H | -- | -- | |
| Brockman Blaine H | -- | -- | |
| Wilde Cliffton W | -- | Associated Title Company |
Source: Public Records
Mortgage History
| Date | Status | Borrower | Loan Amount |
|---|---|---|---|
| Previous Owner | Brockman Blaine H | $124,387 | |
| Previous Owner | Wilde Cliffton W | $105,215 |
Source: Public Records
Tax History Compared to Growth
Tax History
| Year | Tax Paid | Tax Assessment Tax Assessment Total Assessment is a certain percentage of the fair market value that is determined by local assessors to be the total taxable value of land and additions on the property. | Land | Improvement |
|---|---|---|---|---|
| 2024 | $3,312 | $349,250 | $118,170 | $231,080 |
| 2023 | $3,299 | $616,000 | $262,054 | $353,946 |
| 2022 | $3,370 | $353,100 | $141,050 | $212,050 |
| 2021 | $3,127 | $491,000 | $190,823 | $300,177 |
| 2020 | $2,577 | $394,000 | $163,688 | $230,312 |
| 2019 | $2,464 | $370,000 | $180,127 | $189,873 |
| 2018 | $2,285 | $342,000 | $159,281 | $182,719 |
| 2016 | $2,161 | $170,060 | $42,712 | $127,348 |
| 2015 | $2,085 | $155,760 | $42,712 | $113,048 |
| 2014 | $1,173 | $89,221 | $42,712 | $46,509 |
| 2013 | -- | $83,952 | $51,203 | $32,749 |
Source: Public Records
Map
Nearby Homes