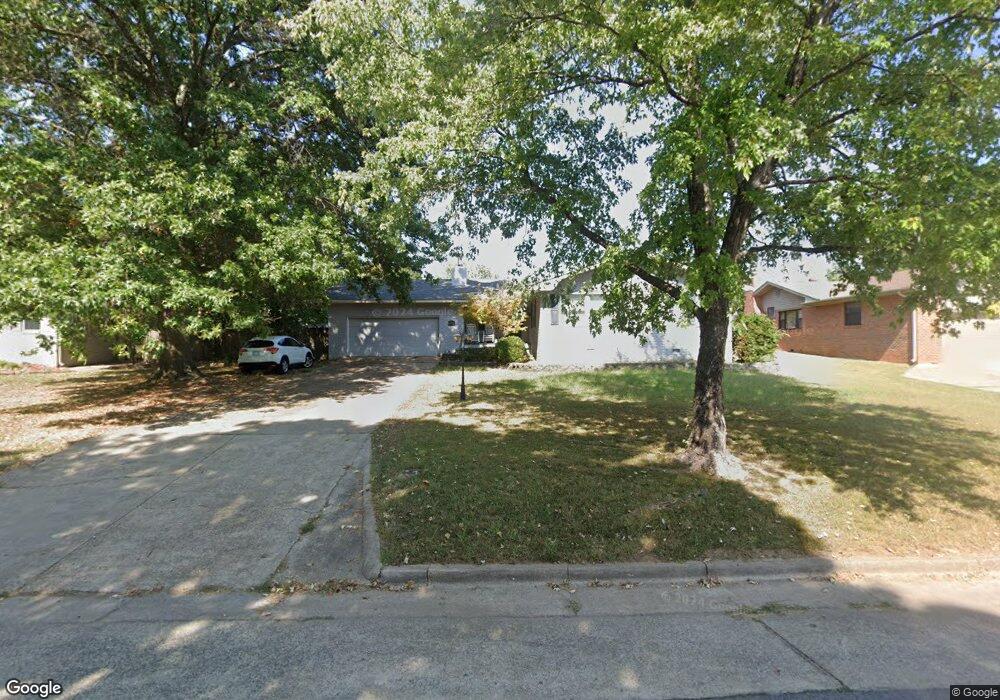
419 E Fuller St Tahlequah, OK 74464
Estimated Value: $175,608 - $225,000
3
Beds
2
Baths
1,720
Sq Ft
$119/Sq Ft
Est. Value
About This Home
This home is located at 419 E Fuller St, Tahlequah, OK 74464 and is currently estimated at $204,902, approximately $119 per square foot. 419 E Fuller St is a home located in Cherokee County with nearby schools including Greenwood Elementary School, Cherokee Elementary School, and Tahlequah Middle School.
Ownership History
Date
Name
Owned For
Owner Type
Purchase Details
Closed on
Mar 28, 2019
Sold by
Retherford Thomas A
Bought by
Retherford Thomas Aaron
Current Estimated Value
Purchase Details
Closed on
Nov 25, 2009
Sold by
Morris David and Morris Jan
Bought by
Retherford Thomas A and Retherford Joella J
Home Financials for this Owner
Home Financials are based on the most recent Mortgage that was taken out on this home.
Original Mortgage
$116,280
Outstanding Balance
$75,654
Interest Rate
4.93%
Mortgage Type
New Conventional
Estimated Equity
$129,248
Purchase Details
Closed on
Aug 6, 1999
Sold by
Goodnight J and Goodnight Burris L
Bought by
David and Jan Morris
Purchase Details
Closed on
May 24, 1999
Sold by
Wanda Ward and Glenn Johnson
Bought by
Jimmy Goodnight and Jimmy Burris L
Purchase Details
Closed on
Apr 10, 1995
Sold by
Emmit and Wheat Helen L
Bought by
Wanda J Ward
Create a Home Valuation Report for This Property
The Home Valuation Report is an in-depth analysis detailing your home's value as well as a comparison with similar homes in the area
Home Values in the Area
Average Home Value in this Area
Purchase History
| Date | Buyer | Sale Price | Title Company |
|---|---|---|---|
| Retherford Thomas Aaron | -- | None Available | |
| Retherford Thomas A | $120,000 | None Available | |
| David | $75,000 | -- | |
| Jimmy Goodnight | $63,000 | -- | |
| Wanda J Ward | $55,500 | -- |
Source: Public Records
Mortgage History
| Date | Status | Borrower | Loan Amount |
|---|---|---|---|
| Open | Retherford Thomas A | $116,280 |
Source: Public Records
Tax History Compared to Growth
Tax History
| Year | Tax Paid | Tax Assessment Tax Assessment Total Assessment is a certain percentage of the fair market value that is determined by local assessors to be the total taxable value of land and additions on the property. | Land | Improvement |
|---|---|---|---|---|
| 2025 | $904 | $10,219 | $1,239 | $8,980 |
| 2024 | $904 | $10,545 | $1,239 | $9,306 |
| 2023 | $904 | $13,715 | $1,234 | $12,481 |
| 2022 | $1,180 | $13,715 | $1,234 | $12,481 |
| 2021 | $1,184 | $13,715 | $1,234 | $12,481 |
| 2020 | $1,205 | $13,715 | $1,234 | $12,481 |
| 2019 | $1,195 | $13,715 | $1,234 | $12,481 |
| 2018 | $1,199 | $13,613 | $1,234 | $12,379 |
| 2017 | $1,197 | $13,613 | $1,234 | $12,379 |
| 2016 | $1,300 | $13,613 | $1,234 | $12,379 |
| 2015 | $1,243 | $13,860 | $1,184 | $12,676 |
| 2014 | $1,243 | $13,200 | $1,232 | $11,968 |
Source: Public Records
Map
Nearby Homes
- 104 Tommye Ln
- 111 N Logan Dr
- 215 S Maple Ave
- 619 E Cherrie St
- 101 S Harrison Ave
- 103 S Harrison Ave
- 403 S Bluff Ave
- 605 S Oak Ave
- 200 Remington Place
- 508 Covington Place
- 609 E Ward St
- 605 E Ward St
- 0 S Hwy 82 A Hwy Unit 2532332
- 640 N Oklahoma Ave
- 720 S East Ave
- 413 Greenwood Dr
- 201 Sandy Cir
- 508 Garden Rd
- 204 Woodhaven Ave
- 1025 E Downing St
- 425 E Fuller St
- 411 E Fuller St
- 406 E Boone St
- 412 E Fuller St
- 433 E Fuller St
- 408 E Boone St
- 526 E Fuller St
- 301 E Fuller St
- 416 E Fuller St
- 404 E Boone St
- 101 S Oak Ave
- 0 E Bertha Parker Bypass Unit 1604275
- 0 E Bertha Parker Bypass Unit 1539272
- 408 E Fuller St
- 419 E Keetoowah St
- 421 E Keetoowah St
- 602 E Boone St
- 100 N Ash Ave
- 51 East Dr
- 104 S Oak Ave