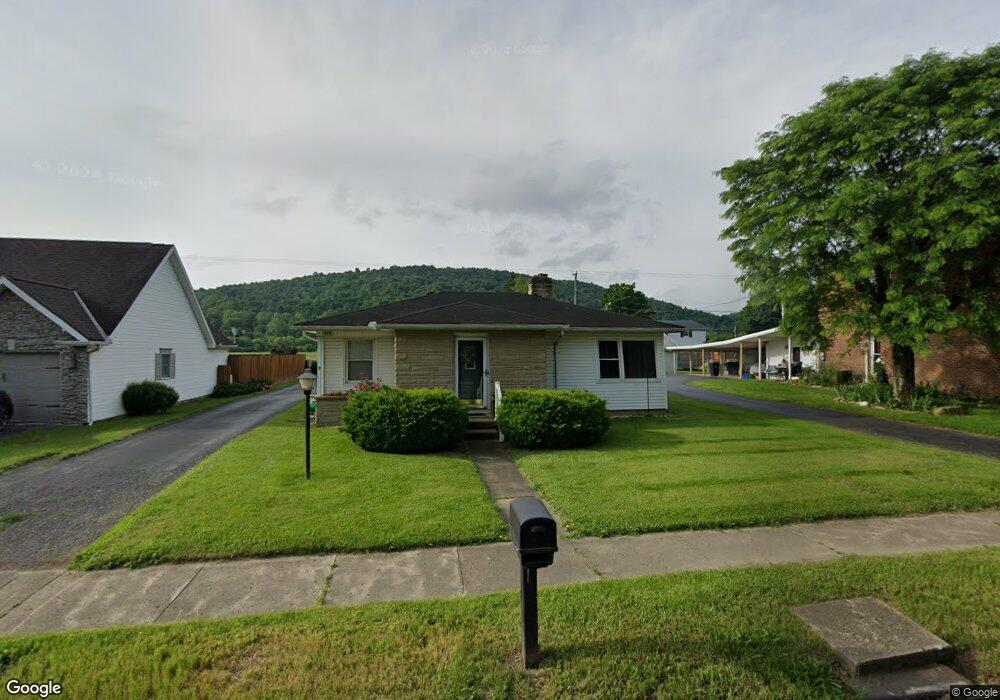
419 E Main St Bainbridge, OH 45612
Estimated Value: $121,000 - $148,000
Studio
1
Bath
990
Sq Ft
$134/Sq Ft
Est. Value
About This Home
This home is located at 419 E Main St, Bainbridge, OH 45612 and is currently estimated at $132,333, approximately $133 per square foot. 419 E Main St is a home located in Ross County with nearby schools including Paint Valley Elementary School, Paint Valley Middle School, and Paint Valley High School.
Ownership History
Date
Name
Owned For
Owner Type
Purchase Details
Closed on
Oct 2, 2020
Sold by
Purdum Rhonda M
Bought by
Purdum Mason A
Current Estimated Value
Purchase Details
Closed on
Apr 10, 2015
Sold by
Purdum Bruce A and Purdum Rhonda M
Bought by
Livin Purdum Rhonda M and Bruce A Purdum Revocable Living Trust
Purchase Details
Closed on
Mar 6, 2013
Sold by
Rhoades Tamara J
Bought by
Purdum Mason A and Purdum Karen R
Home Financials for this Owner
Home Financials are based on the most recent Mortgage that was taken out on this home.
Original Mortgage
$600,000
Outstanding Balance
$273,365
Interest Rate
3.38%
Mortgage Type
Purchase Money Mortgage
Estimated Equity
-$141,032
Purchase Details
Closed on
Dec 13, 2011
Sold by
Stanley Thelma
Bought by
Purdum Bruce A
Purchase Details
Closed on
Apr 25, 2005
Sold by
Stanley Kathy Sue
Bought by
Stanley Thelma
Create a Home Valuation Report for This Property
The Home Valuation Report is an in-depth analysis detailing your home's value as well as a comparison with similar homes in the area
Purchase History
| Date | Buyer | Sale Price | Title Company |
|---|---|---|---|
| Purdum Mason A | -- | None Available | |
| Livin Purdum Rhonda M | -- | None Available | |
| Purdum Mason A | $600,000 | Arrow Title Agency Llc | |
| Purdum Bruce A | $50,000 | Attorney | |
| Stanley Thelma | -- | None Available |
Source: Public Records
Mortgage History
| Date | Status | Borrower | Loan Amount |
|---|---|---|---|
| Open | Purdum Mason A | $600,000 |
Source: Public Records
Tax History
| Year | Tax Paid | Tax Assessment Tax Assessment Total Assessment is a certain percentage of the fair market value that is determined by local assessors to be the total taxable value of land and additions on the property. | Land | Improvement |
|---|---|---|---|---|
| 2024 | $1,394 | $34,340 | $4,080 | $30,260 |
| 2023 | $1,394 | $34,340 | $4,080 | $30,260 |
| 2022 | $1,400 | $34,340 | $4,080 | $30,260 |
| 2021 | $1,176 | $26,190 | $3,210 | $22,980 |
| 2020 | $1,201 | $26,190 | $3,210 | $22,980 |
| 2019 | $1,220 | $26,190 | $3,210 | $22,980 |
| 2018 | $1,113 | $24,120 | $2,770 | $21,350 |
| 2017 | $1,115 | $24,120 | $2,770 | $21,350 |
| 2016 | $1,091 | $24,120 | $2,770 | $21,350 |
| 2015 | $1,038 | $23,340 | $2,770 | $20,570 |
| 2014 | $988 | $23,340 | $2,770 | $20,570 |
| 2013 | $1,003 | $23,340 | $2,770 | $20,570 |
Source: Public Records
Map
Nearby Homes
- 116 E 3rd St
- 500 S Quarry St
- 316 W Main St
- 329 Kinzer Rd
- 4790 Jester Hill Rd
- 0 E Sd Benner Oh Unit 225046180
- 1314 U S 50
- 1314 US Highway 50 W
- 4511 Potts Hill Rd
- 560 Landrum Rd
- 5957 Greenbriar Rd
- 0 Potts Hill Rd Unit 225030231
- 0 Potts Hill Rd Unit 225030226
- 201 Pike Lake Rd Unit (Tract 3 Barn Pike L
- 2384 Cliff Run Rd
- 14703 Brier Rd
- 7149 Potts Hill Rd
- 3194 State Route 41 S
- 42 Barrett Mill Rd
- 14240 Briar Hill Rd
Your Personal Tour Guide
Ask me questions while you tour the home.