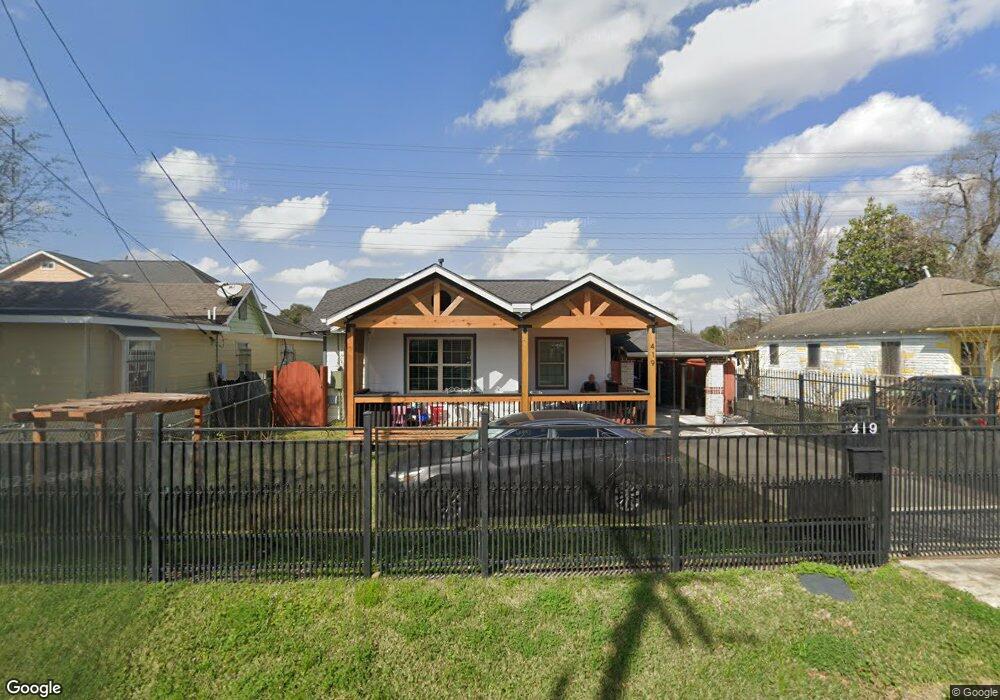
419 Frisco St Houston, TX 77022
Northside-Northline NeighborhoodEstimated Value: $161,119 - $264,000
2
Beds
1
Bath
1,006
Sq Ft
$224/Sq Ft
Est. Value
About This Home
This home is located at 419 Frisco St, Houston, TX 77022 and is currently estimated at $225,030, approximately $223 per square foot. 419 Frisco St is a home located in Harris County with nearby schools including Roosevelt Elementary School, Burbank Middle School, and Northside High School.
Ownership History
Date
Name
Owned For
Owner Type
Purchase Details
Closed on
Apr 28, 2000
Sold by
Nork Thomas R and Nork Debra L
Bought by
Cutter Ernest and Winchell Alexa R
Current Estimated Value
Home Financials for this Owner
Home Financials are based on the most recent Mortgage that was taken out on this home.
Original Mortgage
$272,000
Outstanding Balance
$93,019
Interest Rate
8%
Estimated Equity
$132,011
Purchase Details
Closed on
Feb 2, 1998
Sold by
Realty Portfolio Inc
Bought by
Perez Jose Luis and Perez Liliana
Home Financials for this Owner
Home Financials are based on the most recent Mortgage that was taken out on this home.
Original Mortgage
$35,000
Interest Rate
6.98%
Mortgage Type
Seller Take Back
Create a Home Valuation Report for This Property
The Home Valuation Report is an in-depth analysis detailing your home's value as well as a comparison with similar homes in the area
Home Values in the Area
Average Home Value in this Area
Purchase History
| Date | Buyer | Sale Price | Title Company |
|---|---|---|---|
| Cutter Ernest | -- | -- | |
| Perez Jose Luis | -- | -- |
Source: Public Records
Mortgage History
| Date | Status | Borrower | Loan Amount |
|---|---|---|---|
| Open | Cutter Ernest | $272,000 | |
| Previous Owner | Perez Jose Luis | $35,000 | |
| Closed | Perez Jose Luis | $1,800 | |
| Closed | Cutter Ernest | $51,000 |
Source: Public Records
Tax History Compared to Growth
Tax History
| Year | Tax Paid | Tax Assessment Tax Assessment Total Assessment is a certain percentage of the fair market value that is determined by local assessors to be the total taxable value of land and additions on the property. | Land | Improvement |
|---|---|---|---|---|
| 2025 | $1,514 | $157,684 | $86,625 | $71,059 |
| 2024 | $1,514 | $157,684 | $86,625 | $71,059 |
| 2023 | $1,514 | $167,244 | $74,250 | $92,994 |
| 2022 | $2,586 | $145,940 | $49,005 | $96,935 |
| 2021 | $2,488 | $122,841 | $49,005 | $73,836 |
| 2020 | $2,350 | $113,055 | $49,005 | $64,050 |
| 2019 | $2,232 | $110,879 | $49,005 | $61,874 |
| 2018 | $1,330 | $91,578 | $49,005 | $42,573 |
| 2017 | $1,844 | $91,578 | $49,005 | $42,573 |
| 2016 | $1,676 | $91,578 | $49,005 | $42,573 |
| 2015 | $953 | $72,041 | $24,750 | $47,291 |
| 2014 | $953 | $65,875 | $17,325 | $48,550 |
Source: Public Records
Map
Nearby Homes
- 319 Melbourne St
- 214 Frisco St
- 6515 Lloyd St
- 6825 Appleton St
- 613 Melbourne St
- 522 Caplin St
- 513 Reid St
- 220 Caplin St
- 205 Caplin St
- 702 Caplin St
- 311 & 309 Bennington St
- 317 Kelley St
- 605 Kelley St
- 7015 Roswell St
- 6305 Gay St
- 105 Delaney St
- 809 Dorchester St
- 516 Eleanor St
- 317 Avenue of Oaks St
- 931 Bennington St