
419 Hood Ln Wilder, TN 38589
Estimated payment $1,851/month
Total Views
2,442
5
Acres
$63,230
Price per Acre
223,898
Sq Ft Lot
About This Lot
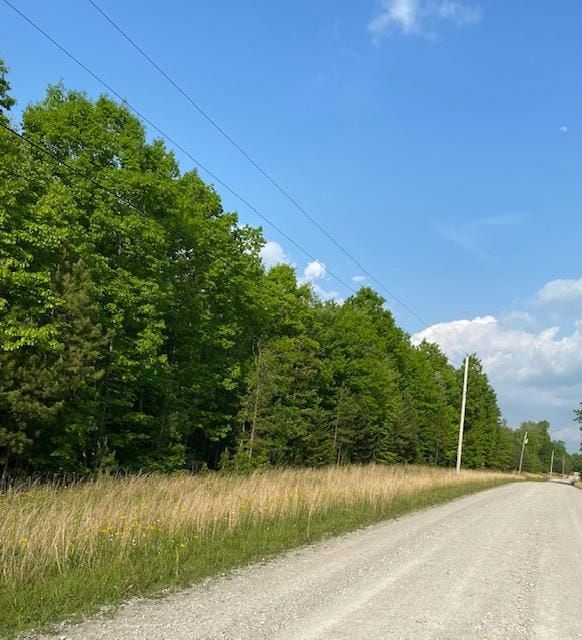
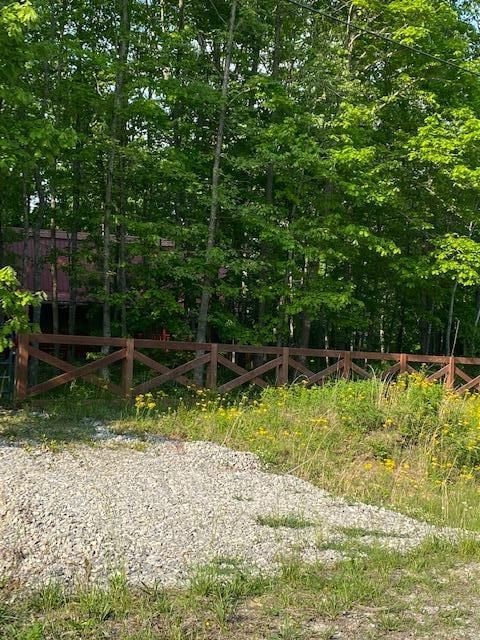
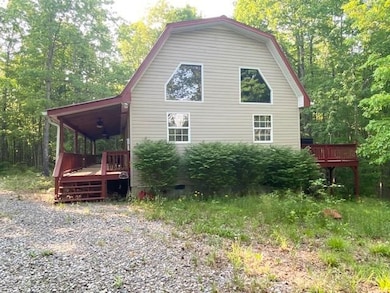
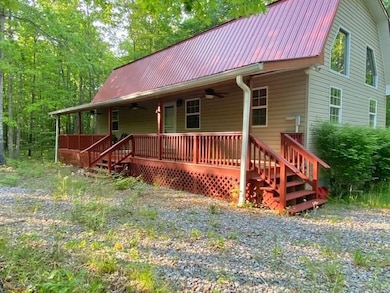
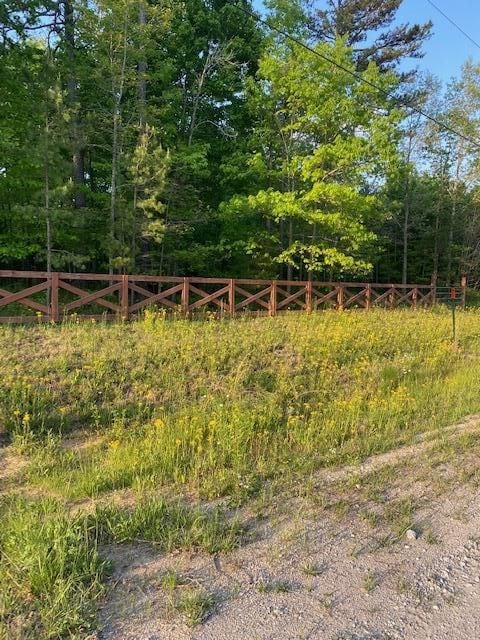
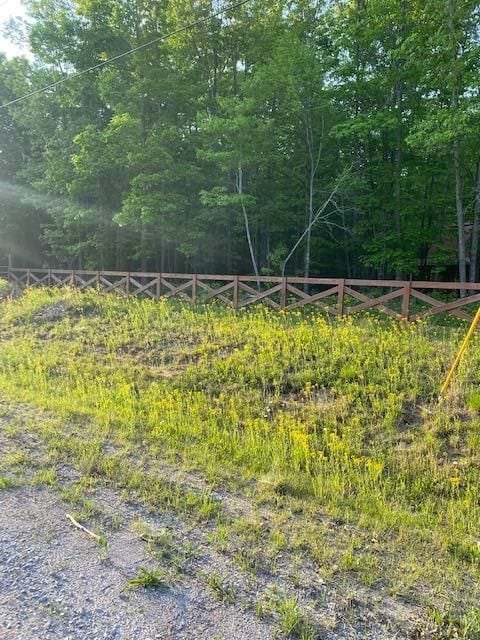
Great opportunity to purchase a move in ready home and avoid the construction process. The home is a spacious 3 bed 2 bath, with a beautiful front and back decks. Enjoy a relaxing morning coffee on back deck overlooking green lush forest where deer and turkey often visit. The home is custom made with a wonderful loft overlooking the main entertaining area. The property is very wooded and has plenty room for critters or gardens. Fiber optic internet available. Furnishings are negotiable
Listing Provided By

Property Details
Property Type
- Land
Est. Annual Taxes
- $676
Lot Details
- Property fronts a private road
- Interior Lot
- Lot Has A Rolling Slope
- Few Trees
- Current uses include residential single
- Potential uses include residential single
Outdoor Features
- Wildlife includes whitetail deer, quails, turkeys, hog
Map
Create a Home Valuation Report for This Property
The Home Valuation Report is an in-depth analysis detailing your home's value as well as a comparison with similar homes in the area
Home Values in the Area
Average Home Value in this Area
Tax History
| Year | Tax Paid | Tax Assessment Tax Assessment Total Assessment is a certain percentage of the fair market value that is determined by local assessors to be the total taxable value of land and additions on the property. | Land | Improvement |
|---|---|---|---|---|
| 2024 | $676 | $50,100 | $12,850 | $37,250 |
| 2023 | $676 | $50,100 | $12,850 | $37,250 |
| 2022 | $572 | $29,950 | $7,700 | $22,250 |
| 2021 | $572 | $29,950 | $7,700 | $22,250 |
| 2020 | $572 | $29,950 | $7,700 | $22,250 |
| 2019 | $572 | $29,950 | $7,700 | $22,250 |
| 2018 | $572 | $29,950 | $7,700 | $22,250 |
| 2017 | $576 | $29,025 | $7,700 | $21,325 |
| 2016 | $576 | $29,025 | $7,700 | $21,325 |
| 2015 | $576 | $29,029 | $0 | $0 |
| 2014 | $576 | $29,029 | $0 | $0 |
Source: Public Records
Property History
| Date | Event | Price | Change | Sq Ft Price |
|---|---|---|---|---|
| 07/17/2025 07/17/25 | For Sale | $325,000 | 0.0% | $188 / Sq Ft |
| 05/15/2022 05/15/22 | For Sale | $325,000 | +195.5% | -- |
| 02/27/2015 02/27/15 | Sold | $110,000 | 0.0% | $95 / Sq Ft |
| 01/01/1970 01/01/70 | Off Market | $110,000 | -- | -- |
Purchase History
| Date | Type | Sale Price | Title Company |
|---|---|---|---|
| Warranty Deed | $110,000 | -- |
Source: Public Records
Mortgage History
| Date | Status | Loan Amount | Loan Type |
|---|---|---|---|
| Open | $84,908 | Cash |
Source: Public Records
Nearby Homes
- Lot 239 Hood Ln
- Lot BCD Hood Ln
- Lot 354 Hood Ln
- Lot 340 Deep Branch Ln
- 00 Deep Branch Ln
- 0 Deep Branch Ln Unit 22257307
- 0 Hilltop Ln Unit RTC2922671
- 0 Hilltop Ln Unit RTC2922630
- 0 Panther Falls Rd
- 1136 Parkstown Extension
- 619 Flat Top View Ln
- 0 Parkstown Extension
- Lot 48 Parkstown Extension
- 911 Parkstown Extension
- LOT 371 E Obey Ln
- 0 Big Piney Loop Unit 1305889
- 0 Big Piney Loop Unit 21629939
- Lot 308 Hilltop Ln
- Lot 222 Hilltop Ln
- Lot 160 Big Piney Loop
- 11 Milnor Cir
- 36 Lakeshore Terrace Unit 14
- 43 Wilshire Heights Dr
- 6016 Calfkiller Hwy Unit A
- 30 Woodland Terrace
- 122 Lee Cir
- 40 Heather Ridge Cir
- 3284 Mirandy Rd
- 7901 Hilham Rd
- 3429 Wj Robinson Rd
- 25 Becker Blvd
- 165 School Ave Unit 165 School Avenue
- 250 New Day Ln
- 28 Jacobs Crossing Dr
- 2835 Deck Mountain Rd
- 1620 Ridgecrest Dr Unit Ridgecrest A
- 99 Copper Springs Cir
- 1010 Country Club Rd
- 1430 Spring Pointe Ln
- 1433 Spring Pointe Ln