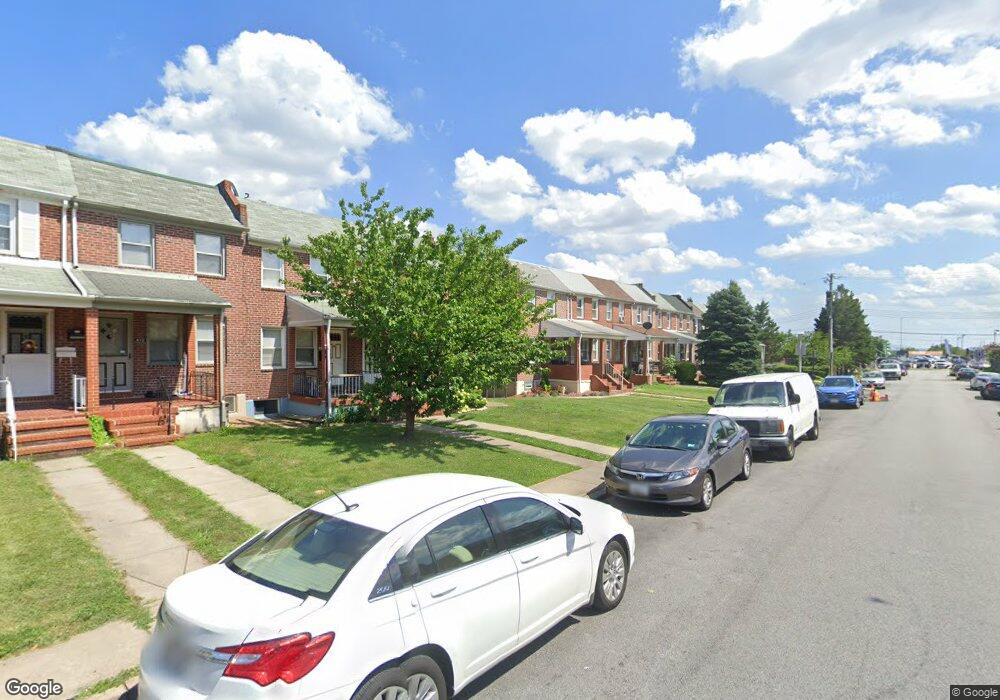
419 Joplin St Baltimore, MD 21224
Estimated Value: $196,696 - $210,000
--
Bed
1
Bath
1,024
Sq Ft
$199/Sq Ft
Est. Value
About This Home
This home is located at 419 Joplin St, Baltimore, MD 21224 and is currently estimated at $203,348, approximately $198 per square foot. 419 Joplin St is a home located in Baltimore City with nearby schools including Graceland Park-O'Donnell Heights Elementary/Middle School, Booker T. Washington Middle School, and Patterson High School.
Ownership History
Date
Name
Owned For
Owner Type
Purchase Details
Closed on
Jul 13, 2022
Sold by
Brian Doherty
Bought by
Moreno Maria Del Carmen
Current Estimated Value
Home Financials for this Owner
Home Financials are based on the most recent Mortgage that was taken out on this home.
Original Mortgage
$173,992
Outstanding Balance
$166,480
Interest Rate
5.78%
Mortgage Type
FHA
Estimated Equity
$36,868
Purchase Details
Closed on
Aug 6, 2004
Sold by
Getz Gertrude
Bought by
Doherty Brian P
Create a Home Valuation Report for This Property
The Home Valuation Report is an in-depth analysis detailing your home's value as well as a comparison with similar homes in the area
Home Values in the Area
Average Home Value in this Area
Purchase History
| Date | Buyer | Sale Price | Title Company |
|---|---|---|---|
| Moreno Maria Del Carmen | $180,000 | First American Title | |
| Moreno Maria Del Carmen | $180,000 | First American Title | |
| Doherty Brian P | $97,000 | -- |
Source: Public Records
Mortgage History
| Date | Status | Borrower | Loan Amount |
|---|---|---|---|
| Open | Moreno Maria Del Carmen | $173,992 | |
| Closed | Moreno Maria Del Carmen | $173,992 |
Source: Public Records
Tax History Compared to Growth
Tax History
| Year | Tax Paid | Tax Assessment Tax Assessment Total Assessment is a certain percentage of the fair market value that is determined by local assessors to be the total taxable value of land and additions on the property. | Land | Improvement |
|---|---|---|---|---|
| 2025 | $3,054 | $140,700 | $25,000 | $115,700 |
| 2024 | $3,054 | $132,800 | $0 | $0 |
| 2023 | $2,934 | $124,900 | $0 | $0 |
| 2022 | $2,761 | $117,000 | $25,000 | $92,000 |
| 2021 | $2,715 | $115,033 | $0 | $0 |
| 2020 | $2,668 | $113,067 | $0 | $0 |
| 2019 | $2,609 | $111,100 | $25,000 | $86,100 |
| 2018 | $2,384 | $110,133 | $0 | $0 |
| 2017 | $2,389 | $109,167 | $0 | $0 |
| 2016 | $2,245 | $108,200 | $0 | $0 |
| 2015 | $2,245 | $108,200 | $0 | $0 |
| 2014 | $2,245 | $108,200 | $0 | $0 |
Source: Public Records
Map
Nearby Homes