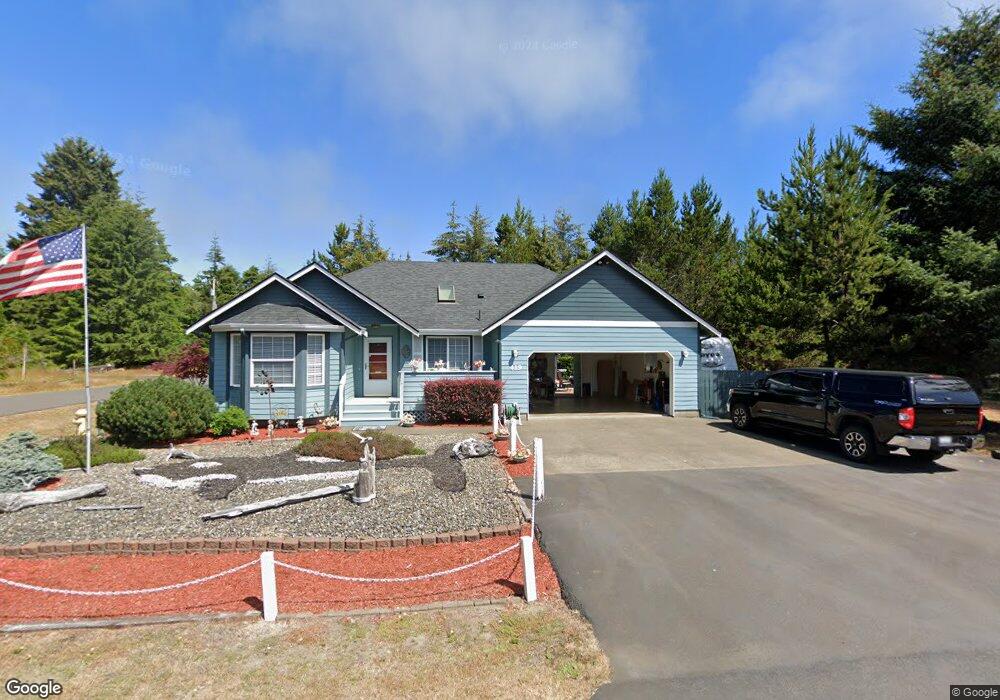
419 Lake West Loop NE Ocean Shores, WA 98569
Estimated Value: $363,169 - $420,000
2
Beds
1
Bath
1,206
Sq Ft
$325/Sq Ft
Est. Value
About This Home
This home is located at 419 Lake West Loop NE, Ocean Shores, WA 98569 and is currently estimated at $392,542, approximately $325 per square foot. 419 Lake West Loop NE is a home located in Grays Harbor County with nearby schools including North Beach Junior/Senior High School.
Ownership History
Date
Name
Owned For
Owner Type
Purchase Details
Closed on
Mar 16, 2016
Sold by
Kapelos Thomas J
Bought by
Quenga Jose C and Quenga Diana R
Current Estimated Value
Home Financials for this Owner
Home Financials are based on the most recent Mortgage that was taken out on this home.
Original Mortgage
$140,600
Outstanding Balance
$111,284
Interest Rate
3.65%
Mortgage Type
New Conventional
Estimated Equity
$281,258
Purchase Details
Closed on
Apr 4, 2012
Sold by
Hepperlen Joan M
Bought by
Kapelos Carolynne and Kapelos Thomas J
Home Financials for this Owner
Home Financials are based on the most recent Mortgage that was taken out on this home.
Original Mortgage
$139,900
Interest Rate
3.86%
Mortgage Type
VA
Purchase Details
Closed on
Sep 2, 2010
Sold by
Hepperlen Joan M
Bought by
Hepperlen Joan M and Joan M Hepperlen Living Trust
Create a Home Valuation Report for This Property
The Home Valuation Report is an in-depth analysis detailing your home's value as well as a comparison with similar homes in the area
Home Values in the Area
Average Home Value in this Area
Purchase History
| Date | Buyer | Sale Price | Title Company |
|---|---|---|---|
| Quenga Jose C | $148,000 | Grays Harbor Title | |
| Kapelos Carolynne | $137,000 | Coast Title | |
| Hepperlen Joan M | -- | None Available |
Source: Public Records
Mortgage History
| Date | Status | Borrower | Loan Amount |
|---|---|---|---|
| Open | Quenga Jose C | $140,600 | |
| Previous Owner | Kapelos Carolynne | $139,900 |
Source: Public Records
Tax History Compared to Growth
Tax History
| Year | Tax Paid | Tax Assessment Tax Assessment Total Assessment is a certain percentage of the fair market value that is determined by local assessors to be the total taxable value of land and additions on the property. | Land | Improvement |
|---|---|---|---|---|
| 2025 | $2,482 | $391,903 | $45,000 | $346,903 |
| 2023 | $2,507 | $338,157 | $75,000 | $263,157 |
| 2022 | $1,899 | $224,706 | $54,200 | $170,506 |
| 2021 | $2,164 | $224,706 | $54,200 | $170,506 |
| 2020 | $2,029 | $209,584 | $37,375 | $172,209 |
| 2019 | $1,976 | $189,054 | $32,500 | $156,554 |
| 2018 | $1,726 | $179,415 | $25,000 | $154,415 |
| 2017 | $1,556 | $148,086 | $25,000 | $123,086 |
| 2016 | $1,462 | $130,650 | $22,000 | $108,650 |
| 2014 | -- | $124,430 | $12,000 | $112,430 |
| 2013 | -- | $138,260 | $15,000 | $123,260 |
Source: Public Records
Map
Nearby Homes
- 445 Bass Ave NE
- 470 Lake West Loop NE
- 430 Dolphin Ave NE
- 433 Dolphin Ave NE
- 457 Dolphin Ave NE
- 490 Dolphin Ave NE
- 413 Lakeview Loop NE
- 448 Octopus Ave NE
- 394 Lakeview Loop NE
- 441 Bass Ave NE
- 505 E Chance A La Mer NE
- 366 Lakeview Loop NE
- 465 Octopus Ave NE
- 360 Lakeview Loop NE
- 387 Duck Lake Dr NE
- 337 Hyde Ct NE
- 359 Duck Lake Dr NE
- 336 Hyde Ct NE
- 520 Dolphin Ave NE
- 314 Lakeview Loop NE
- 419 Lakewest Loop NE
- 365 Lake West Loop NE
- 421 Lake West Loop NE
- 421 Lakewest Loop NE
- 436 W Court Loop NE
- 438 W Court Loop NE
- 438 W Court Loop NE
- 423 Lakewest Loop NE
- 418 Lakewest Loop NE
- 416 Bass Ave NE
- 420 Lake West Loop NE
- 420 Lakewest Loop NE
- 440 W Court Loop NE
- 423 Bass Ave NE
- 431 Bass Ave NE
- 422 Lake West Loop NE
- 425 Lakewest Loop NE
- 425 Lakewest Lp
- 422 Lakewest Loop NE
- 419 Bass Ave NE