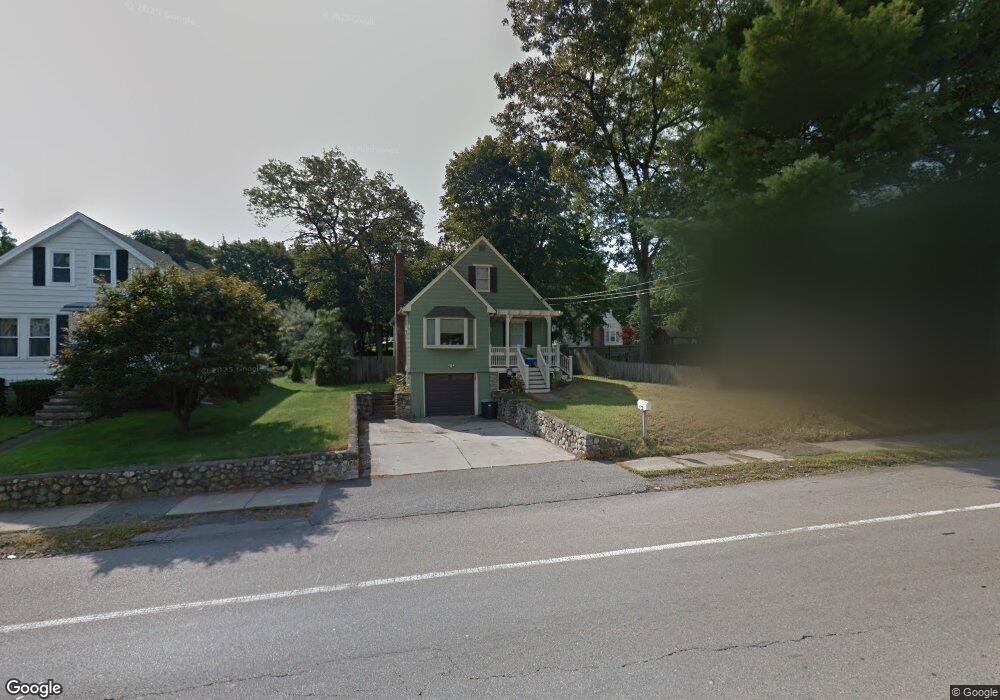
419 Main St Walpole, MA 02081
Estimated Value: $588,237 - $631,000
3
Beds
1
Bath
1,238
Sq Ft
$496/Sq Ft
Est. Value
About This Home
This home is located at 419 Main St, Walpole, MA 02081 and is currently estimated at $613,809, approximately $495 per square foot. 419 Main St is a home located in Norfolk County with nearby schools including Fisher School, Walpole Middle School, and Walpole High School.
Ownership History
Date
Name
Owned For
Owner Type
Purchase Details
Closed on
Dec 28, 2007
Sold by
Farrell Mark W and Farrell Kathleen M
Bought by
Carr James
Current Estimated Value
Home Financials for this Owner
Home Financials are based on the most recent Mortgage that was taken out on this home.
Original Mortgage
$311,314
Outstanding Balance
$197,631
Interest Rate
6.27%
Mortgage Type
Purchase Money Mortgage
Estimated Equity
$416,178
Purchase Details
Closed on
Apr 30, 1999
Sold by
Barajas Rudolph and Barajas Trisha A
Bought by
Farrell Mark W
Home Financials for this Owner
Home Financials are based on the most recent Mortgage that was taken out on this home.
Original Mortgage
$152,900
Interest Rate
6.95%
Mortgage Type
Purchase Money Mortgage
Create a Home Valuation Report for This Property
The Home Valuation Report is an in-depth analysis detailing your home's value as well as a comparison with similar homes in the area
Home Values in the Area
Average Home Value in this Area
Purchase History
| Date | Buyer | Sale Price | Title Company |
|---|---|---|---|
| Carr James | $318,000 | -- | |
| Farrell Mark W | $179,900 | -- |
Source: Public Records
Mortgage History
| Date | Status | Borrower | Loan Amount |
|---|---|---|---|
| Open | Carr James | $311,314 | |
| Previous Owner | Farrell Mark W | $148,500 | |
| Previous Owner | Farrell Mark W | $75,000 | |
| Previous Owner | Farrell Mark W | $152,900 | |
| Previous Owner | Farrell Mark W | $15,000 |
Source: Public Records
Tax History
| Year | Tax Paid | Tax Assessment Tax Assessment Total Assessment is a certain percentage of the fair market value that is determined by local assessors to be the total taxable value of land and additions on the property. | Land | Improvement |
|---|---|---|---|---|
| 2025 | $6,026 | $469,700 | $268,300 | $201,400 |
| 2024 | $5,859 | $443,200 | $258,000 | $185,200 |
| 2023 | $5,737 | $413,000 | $224,300 | $188,700 |
| 2022 | $5,408 | $374,000 | $207,700 | $166,300 |
| 2021 | $5,296 | $356,900 | $195,900 | $161,000 |
| 2020 | $5,226 | $348,600 | $175,100 | $173,500 |
| 2019 | $4,962 | $328,600 | $168,400 | $160,200 |
| 2018 | $4,431 | $290,200 | $152,900 | $137,300 |
| 2017 | $4,283 | $279,400 | $147,000 | $132,400 |
| 2016 | $4,279 | $275,000 | $148,600 | $126,400 |
| 2015 | $3,898 | $248,300 | $125,500 | $122,800 |
| 2014 | $3,617 | $229,500 | $125,500 | $104,000 |
Source: Public Records
Map
Nearby Homes
- 291 Plimpton St
- 7 Tilton Ct Unit Ct
- 241 Fisher St
- 56 North St
- 8 Mckinley Ave
- 363 - 367 Washington St
- 2 Kendall St
- 40 Endean Dr
- 38 Garden Pkwy
- 28 Eastover Rd Unit 28
- 881 Main St Unit 9
- 32 Rainbow Pond Dr Unit B1
- 19 and 23 Arlington Ln
- 120 Polley Ln
- 6 Litchfields Way
- 222 School St Unit 9
- 224 School St Unit 9
- 26 Dover Dr
- 260 Elm St
- Unit 11 Powder House Ln Unit 11
Your Personal Tour Guide
Ask me questions while you tour the home.