Estimated Value: $187,000 - $277,000
2
Beds
1
Bath
2,712
Sq Ft
$84/Sq Ft
Est. Value
About This Home
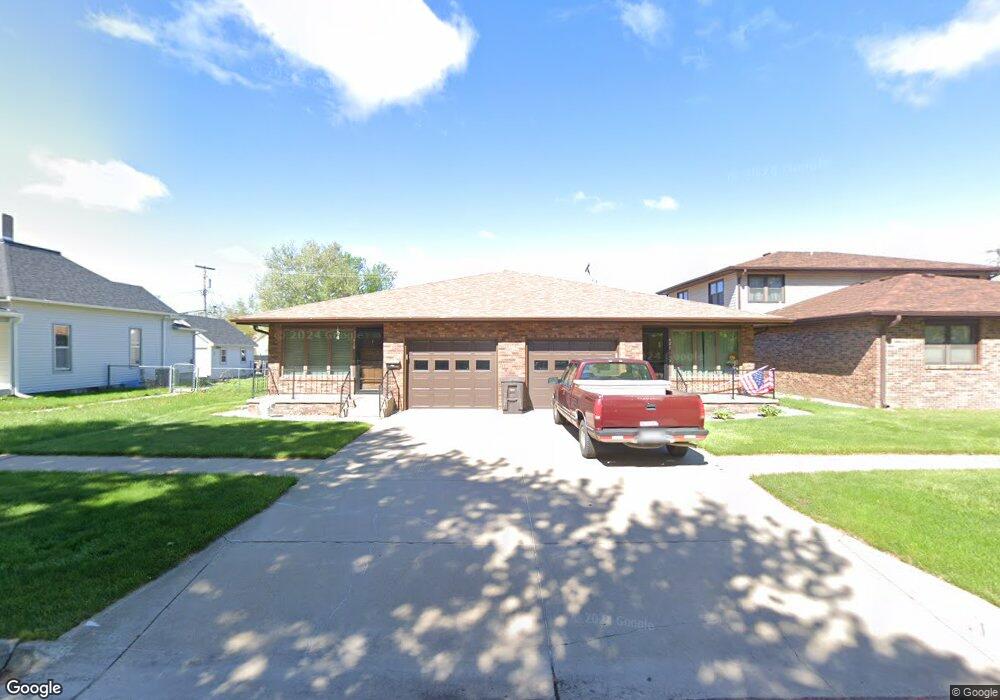
This home is located at 419 N Burlington Ave Unit 421, York, NE 68467 and is currently estimated at $227,566, approximately $83 per square foot. 419 N Burlington Ave Unit 421 is a home located in York County with nearby schools including York Elementary School, York Middle School, and York High School.
Ownership History
Date
Name
Owned For
Owner Type
Purchase Details
Closed on
Jun 11, 2024
Sold by
Melba Willits Revocable Trust and Melba Betts Revocable Trust
Bought by
Mccall Diane K and Mccall George E
Current Estimated Value
Purchase Details
Closed on
Jan 30, 2024
Sold by
Virgil L Willits Revocable Trust and Willits Vinson L
Bought by
Mccall Diane K and Mccall George E
Purchase Details
Closed on
Jan 17, 2014
Sold by
Melba Melba and Betts Melba
Bought by
Willits Melba and Melba Willits Revocable Trust
Purchase Details
Closed on
Jul 28, 2011
Sold by
Willits Melba and Betts Melba
Bought by
Willits Melba and Willits Virgil
Purchase Details
Closed on
Feb 12, 2010
Sold by
Willits Virgil
Bought by
Betts Melba
Purchase Details
Closed on
Jun 15, 2009
Sold by
S & M Farms Inc
Bought by
Virgil Willits Betts and Virgil Willits Melba
Purchase Details
Closed on
Jun 9, 2009
Sold by
S & M Farms Inc
Bought by
Betts Melba and Willits Virgil
Create a Home Valuation Report for This Property
The Home Valuation Report is an in-depth analysis detailing your home's value as well as a comparison with similar homes in the area
Home Values in the Area
Average Home Value in this Area
Purchase History
| Date | Buyer | Sale Price | Title Company |
|---|---|---|---|
| Mccall Diane K | -- | None Listed On Document | |
| Mccall Diane K | $150,000 | None Listed On Document | |
| Willits Melba | -- | -- | |
| Willits Melba | -- | -- | |
| Willits Melba | -- | -- | |
| Betts Melba | -- | -- | |
| Willits Virgil | -- | -- | |
| Betts Melba | -- | -- | |
| Willits Virgil L | -- | -- | |
| Virgil Willits Betts | $160,000 | -- | |
| Betts Melba | -- | York County Title |
Source: Public Records
Tax History Compared to Growth
Tax History
| Year | Tax Paid | Tax Assessment Tax Assessment Total Assessment is a certain percentage of the fair market value that is determined by local assessors to be the total taxable value of land and additions on the property. | Land | Improvement |
|---|---|---|---|---|
| 2024 | $3,522 | $209,572 | $12,960 | $196,612 |
| 2023 | $3,657 | $205,717 | $12,960 | $192,757 |
| 2022 | $3,619 | $205,717 | $12,960 | $192,757 |
| 2021 | $3,603 | $201,937 | $12,960 | $188,977 |
| 2020 | $3,521 | $201,937 | $12,960 | $188,977 |
| 2019 | $3,286 | $188,668 | $12,960 | $175,708 |
| 2018 | $3,185 | $188,668 | $12,960 | $175,708 |
| 2017 | $2,787 | $174,079 | $9,000 | $165,079 |
| 2016 | $2,716 | $166,336 | $7,560 | $158,776 |
| 2015 | $2,680 | $166,336 | $7,560 | $158,776 |
| 2014 | $2,733 | $166,336 | $7,560 | $158,776 |
Source: Public Records
Map
Nearby Homes
- 418 E 5th St
- 320 E 4th St
- 423 E 6th St
- 215 N Burlington Ave
- 309 N East Ave
- 320 N East Ave
- 612 E 4th St
- 618 E 4th St
- 714 N Iowa Ave
- 120 N Iowa Ave
- 808 N Burlington Ave
- 707 N Beaver Ave
- 926 N East Ave
- 908 E 5th St
- 1108 N Nebraska Ave
- 921 N Beaver Ave
- 1114 N Burlington Ave
- 115 S York Ave
- 1125 N Burlington Ave
- 1217 N Grant Ave
- 409 N Burlington Ave
- 421 N Burlington Ave
- 405 N Burlington Ave
- 418 N Nebraska Ave
- 424 N Nebraska Ave
- 404 E 5th St
- 416 N Nebraska Ave
- 412 N Nebraska Ave
- 420 N Burlington Ave
- 315 E 4th St
- 418 N Burlington Ave
- 401 N Burlington Ave
- 406 N Nebraska Ave
- 408 E 5th St
- 303 E 4th St
- 402 N Burlington Ave
- 303 E 5th St
- 500 N Burlington Ave
- 506 N Burlington Ave
- 415 N Nebraska Ave Unit 417