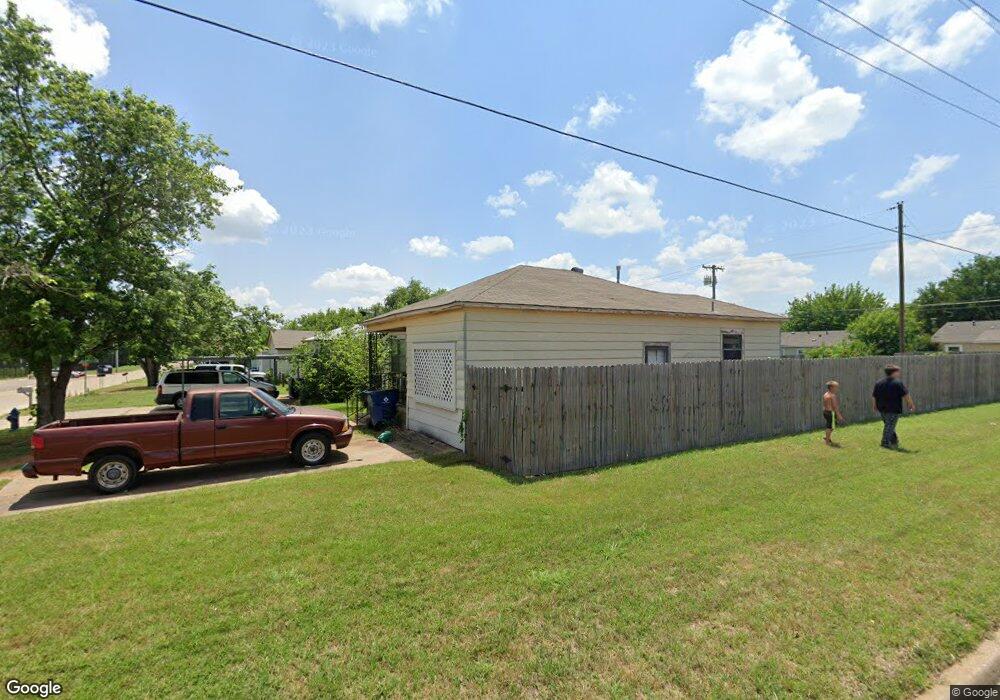
419 N F St Duncan, OK 73533
Estimated Value: $47,000 - $53,488
3
Beds
2
Baths
1,057
Sq Ft
$48/Sq Ft
Est. Value
About This Home
This home is located at 419 N F St, Duncan, OK 73533 and is currently estimated at $50,872, approximately $48 per square foot. 419 N F St is a home located in Stephens County with nearby schools including Woodrow Wilson Elementary School, Duncan Middle School, and Duncan High School.
Ownership History
Date
Name
Owned For
Owner Type
Purchase Details
Closed on
Jul 12, 2024
Sold by
Knabe Brenda S and Knabe Christopher
Bought by
Smith & Young Investments Llc
Current Estimated Value
Home Financials for this Owner
Home Financials are based on the most recent Mortgage that was taken out on this home.
Original Mortgage
$54,931
Outstanding Balance
$54,231
Interest Rate
7.03%
Mortgage Type
New Conventional
Estimated Equity
-$3,359
Purchase Details
Closed on
Aug 4, 2023
Sold by
Knabe Christopher Rodney and Knabe Brenda Sue
Bought by
Knabe Christopher Rodney and Knabe Brenda Sue
Purchase Details
Closed on
Aug 7, 2018
Sold by
Knabe Brenda S and Knabe Christopher R
Bought by
Knabe Brenda S
Purchase Details
Closed on
Jan 5, 2009
Sold by
Pilgrim Laila M
Bought by
Knabe Brenda S and Pilgrim Laila M
Create a Home Valuation Report for This Property
The Home Valuation Report is an in-depth analysis detailing your home's value as well as a comparison with similar homes in the area
Home Values in the Area
Average Home Value in this Area
Purchase History
| Date | Buyer | Sale Price | Title Company |
|---|---|---|---|
| Smith & Young Investments Llc | $47,500 | First American Title | |
| Knabe Christopher Rodney | -- | None Listed On Document | |
| Knabe Christopher Rodney | -- | None Listed On Document | |
| Knabe Brenda S | -- | Title 68 O S | |
| Knabe Brenda S | -- | Immediate Family Title |
Source: Public Records
Mortgage History
| Date | Status | Borrower | Loan Amount |
|---|---|---|---|
| Open | Smith & Young Investments Llc | $54,931 |
Source: Public Records
Tax History Compared to Growth
Tax History
| Year | Tax Paid | Tax Assessment Tax Assessment Total Assessment is a certain percentage of the fair market value that is determined by local assessors to be the total taxable value of land and additions on the property. | Land | Improvement |
|---|---|---|---|---|
| 2025 | $443 | $5,251 | $306 | $4,945 |
| 2024 | $270 | $3,168 | $305 | $2,863 |
| 2023 | $270 | $3,089 | $306 | $2,783 |
| 2022 | $244 | $3,017 | $303 | $2,714 |
| 2021 | $244 | $2,874 | $302 | $2,572 |
| 2020 | $225 | $2,607 | $301 | $2,306 |
| 2019 | $215 | $2,483 | $300 | $2,183 |
| 2018 | $32 | $2,422 | $306 | $2,116 |
| 2017 | $31 | $2,365 | $288 | $2,077 |
| 2016 | $31 | $2,364 | $215 | $2,149 |
| 2015 | $32 | $2,364 | $215 | $2,149 |
| 2014 | $32 | $2,365 | $268 | $2,097 |
Source: Public Records
Map
Nearby Homes