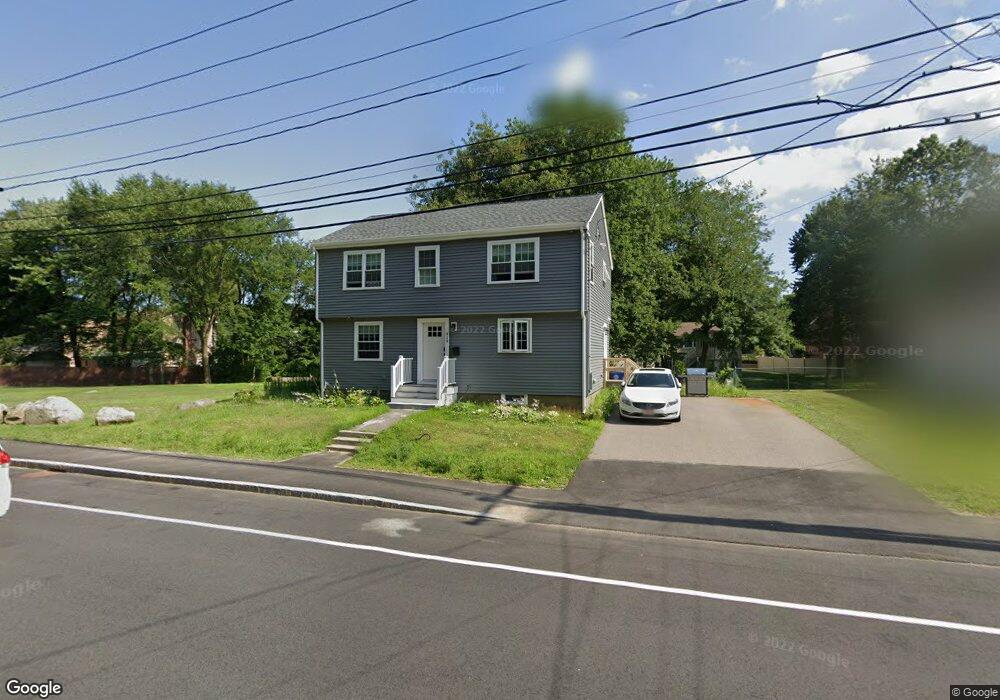
419 Pearl St Braintree, MA 02184
South Braintree NeighborhoodEstimated Value: $673,691 - $883,000
2
Beds
1
Bath
759
Sq Ft
$974/Sq Ft
Est. Value
About This Home
This home is located at 419 Pearl St, Braintree, MA 02184 and is currently estimated at $739,423, approximately $974 per square foot. 419 Pearl St is a home located in Norfolk County with nearby schools including Braintree High School, Sacred Heart Elementary School, and Thayer Academy.
Ownership History
Date
Name
Owned For
Owner Type
Purchase Details
Closed on
Nov 22, 2010
Sold by
Lafleur Ford
Bought by
Jenkins Brian W
Current Estimated Value
Home Financials for this Owner
Home Financials are based on the most recent Mortgage that was taken out on this home.
Original Mortgage
$214,423
Outstanding Balance
$141,689
Interest Rate
4.3%
Mortgage Type
Purchase Money Mortgage
Estimated Equity
$597,734
Create a Home Valuation Report for This Property
The Home Valuation Report is an in-depth analysis detailing your home's value as well as a comparison with similar homes in the area
Home Values in the Area
Average Home Value in this Area
Purchase History
| Date | Buyer | Sale Price | Title Company |
|---|---|---|---|
| Jenkins Brian W | $220,000 | -- |
Source: Public Records
Mortgage History
| Date | Status | Borrower | Loan Amount |
|---|---|---|---|
| Open | Jenkins Brian W | $214,423 |
Source: Public Records
Tax History Compared to Growth
Tax History
| Year | Tax Paid | Tax Assessment Tax Assessment Total Assessment is a certain percentage of the fair market value that is determined by local assessors to be the total taxable value of land and additions on the property. | Land | Improvement |
|---|---|---|---|---|
| 2025 | $5,454 | $546,500 | $297,000 | $249,500 |
| 2024 | $4,950 | $522,200 | $274,500 | $247,700 |
| 2023 | $4,734 | $485,000 | $252,000 | $233,000 |
| 2022 | $4,647 | $467,000 | $234,000 | $233,000 |
| 2021 | $4,100 | $412,100 | $216,000 | $196,100 |
| 2020 | $3,886 | $394,100 | $198,000 | $196,100 |
| 2019 | $2,939 | $291,300 | $198,000 | $93,300 |
| 2018 | $2,748 | $260,700 | $171,000 | $89,700 |
| 2017 | $2,703 | $251,700 | $162,000 | $89,700 |
| 2016 | $2,542 | $231,500 | $144,000 | $87,500 |
| 2015 | $2,463 | $222,500 | $135,000 | $87,500 |
| 2014 | $2,345 | $205,300 | $129,600 | $75,700 |
Source: Public Records
Map
Nearby Homes
- 42 Spring St
- 67 Abby Rd
- 605 Middle St Unit 38
- 428 John Mahar Hwy Unit 301
- 426 John Mahar Hwy Unit 311
- 414 John Mahar Hwy Unit 312
- 418 John Mahar Hwy Unit 408
- 422 John Mahar Hwy Unit 305
- 420 John Mahar Hwy Unit 202
- 61 Grove St
- 14-20 Randall Ave
- 230 Lisle St
- 293 Alida Rd
- 71 Robbie Rd
- 145 Hancock St Unit 214
- 65 Tremont St
- 6 Franklin St
- 501 Commerce Dr Unit 1111
- 501 Commerce Dr Unit 4206
- 501 Commerce Dr Unit 4308