Estimated Value: $146,000 - $157,000
2
Beds
2
Baths
1,704
Sq Ft
$90/Sq Ft
Est. Value
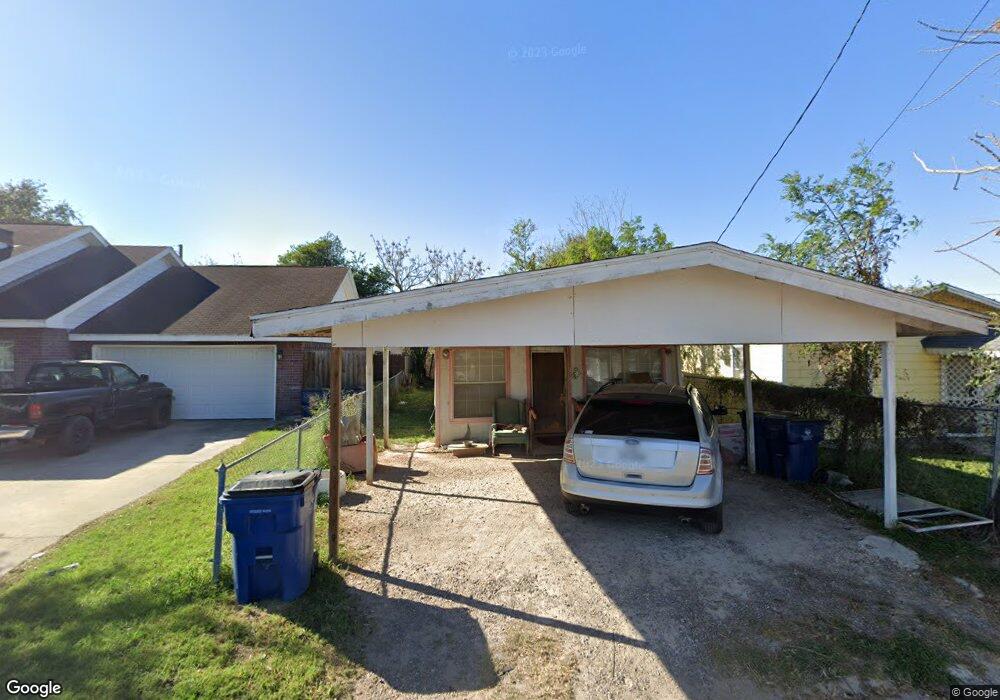
About This Home
This home is located at 419 S 16th St, Donna, TX 78537 and is currently estimated at $152,906, approximately $89 per square foot. 419 S 16th St is a home located in Hidalgo County with nearby schools including C. Stainke Elementary School, W.A. Todd Middle School, and Donna High School.
Ownership History
Date
Name
Owned For
Owner Type
Purchase Details
Closed on
Feb 2, 2024
Sold by
Montemayor Josue Elimelec
Bought by
Munoz Maynor Otoniel Ixpa and Zavala Silvia Jaramillo
Current Estimated Value
Purchase Details
Closed on
Mar 6, 2009
Sold by
Quesada Juanita
Bought by
Lozano Jose B and Lozano Blanca L
Home Financials for this Owner
Home Financials are based on the most recent Mortgage that was taken out on this home.
Original Mortgage
$31,000
Interest Rate
5.36%
Mortgage Type
Seller Take Back
Purchase Details
Closed on
Jan 15, 2008
Sold by
Solis Nicolas
Bought by
Quesada Juanita
Create a Home Valuation Report for This Property
The Home Valuation Report is an in-depth analysis detailing your home's value as well as a comparison with similar homes in the area
Home Values in the Area
Average Home Value in this Area
Purchase History
| Date | Buyer | Sale Price | Title Company |
|---|---|---|---|
| Munoz Maynor Otoniel Ixpa | -- | None Listed On Document | |
| Lozano Jose B | -- | None Available | |
| Quesada Juanita | -- | None Available |
Source: Public Records
Mortgage History
| Date | Status | Borrower | Loan Amount |
|---|---|---|---|
| Previous Owner | Lozano Jose B | $31,000 |
Source: Public Records
Tax History Compared to Growth
Tax History
| Year | Tax Paid | Tax Assessment Tax Assessment Total Assessment is a certain percentage of the fair market value that is determined by local assessors to be the total taxable value of land and additions on the property. | Land | Improvement |
|---|---|---|---|---|
| 2025 | $1,640 | $122,734 | $35,750 | $86,984 |
| 2024 | $1,640 | $81,932 | $30,000 | $51,932 |
| 2023 | $2,172 | $82,571 | $30,000 | $52,571 |
| 2022 | $1,876 | $67,683 | $17,500 | $50,183 |
| 2021 | $1,335 | $47,324 | $17,500 | $41,258 |
| 2020 | $1,255 | $43,022 | $16,000 | $27,469 |
| 2019 | $965 | $32,609 | $14,500 | $18,109 |
| 2018 | $963 | $32,450 | $14,500 | $18,359 |
| 2017 | $932 | $29,500 | $14,500 | $18,521 |
| 2016 | $848 | $26,818 | $10,000 | $16,818 |
| 2015 | $559 | $27,023 | $10,000 | $17,023 |
Source: Public Records
Map
Nearby Homes