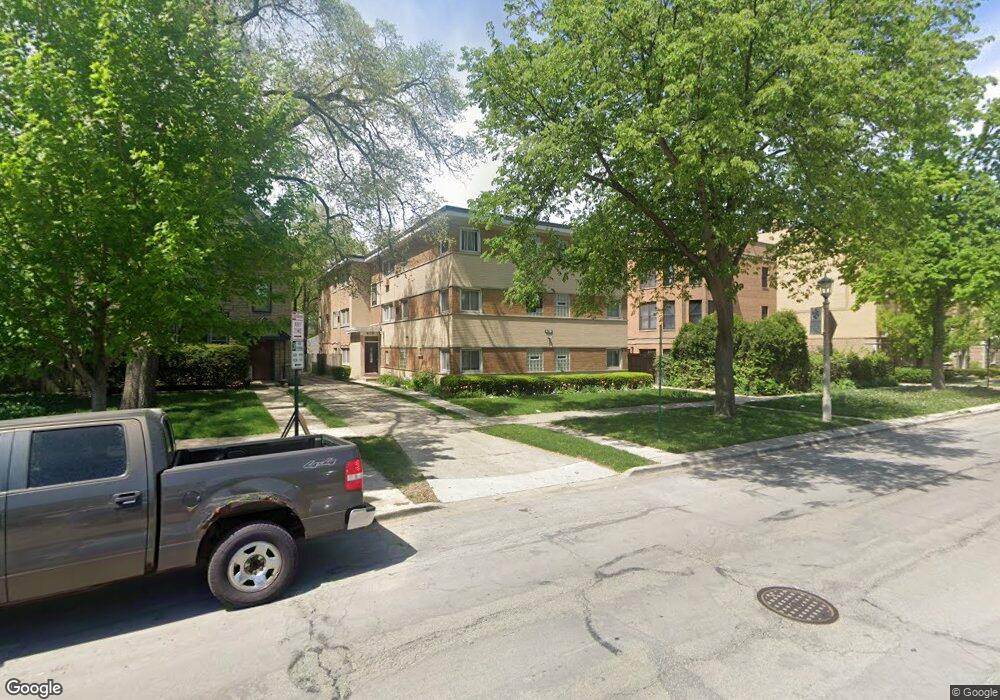
419 S East Ave Unit 3B Oak Park, IL 60302
Estimated Value: $140,000 - $173,000
1
Bed
1
Bath
750
Sq Ft
$207/Sq Ft
Est. Value
About This Home
This home is located at 419 S East Ave Unit 3B, Oak Park, IL 60302 and is currently estimated at $155,073, approximately $206 per square foot. 419 S East Ave Unit 3B is a home located in Cook County with nearby schools including Longfellow Elementary School, Percy Julian Middle School, and Oak Park and River Forest High School.
Ownership History
Date
Name
Owned For
Owner Type
Purchase Details
Closed on
Apr 3, 2017
Sold by
Patel Sunny and Patel Himanshu
Bought by
Kumar Rajeev
Current Estimated Value
Purchase Details
Closed on
Dec 7, 2011
Sold by
Willis Royce
Bought by
Patel Himanshu and Patel Sunny
Purchase Details
Closed on
Nov 23, 2005
Sold by
Meredith Kachardra N
Bought by
Willis Royce
Home Financials for this Owner
Home Financials are based on the most recent Mortgage that was taken out on this home.
Original Mortgage
$139,900
Interest Rate
6.17%
Mortgage Type
Fannie Mae Freddie Mac
Purchase Details
Closed on
Sep 2, 1994
Sold by
Lewis Clinton
Bought by
Cleofe Aurora T and Cleofe Florian V
Home Financials for this Owner
Home Financials are based on the most recent Mortgage that was taken out on this home.
Original Mortgage
$45,000
Interest Rate
6.75%
Create a Home Valuation Report for This Property
The Home Valuation Report is an in-depth analysis detailing your home's value as well as a comparison with similar homes in the area
Home Values in the Area
Average Home Value in this Area
Purchase History
| Date | Buyer | Sale Price | Title Company |
|---|---|---|---|
| Kumar Rajeev | $65,000 | Attorney | |
| Patel Himanshu | $40,500 | -- | |
| Patel Himanshu | $40,500 | -- | |
| Patel Himanshu | $40,500 | -- | |
| Willis Royce | $140,000 | Ticor Title | |
| Cleofe Aurora T | $50,000 | Land Title Group |
Source: Public Records
Mortgage History
| Date | Status | Borrower | Loan Amount |
|---|---|---|---|
| Previous Owner | Willis Royce | $139,900 | |
| Previous Owner | Cleofe Aurora T | $45,000 |
Source: Public Records
Tax History Compared to Growth
Tax History
| Year | Tax Paid | Tax Assessment Tax Assessment Total Assessment is a certain percentage of the fair market value that is determined by local assessors to be the total taxable value of land and additions on the property. | Land | Improvement |
|---|---|---|---|---|
| 2024 | $3,836 | $11,767 | $1,029 | $10,738 |
| 2023 | $2,997 | $11,767 | $1,029 | $10,738 |
| 2022 | $2,997 | $7,806 | $643 | $7,163 |
| 2021 | $2,921 | $7,805 | $643 | $7,162 |
| 2020 | $2,849 | $7,805 | $643 | $7,162 |
| 2019 | $3,176 | $8,279 | $588 | $7,691 |
| 2018 | $3,057 | $8,279 | $588 | $7,691 |
| 2017 | $2,990 | $8,279 | $588 | $7,691 |
| 2016 | $2,949 | $7,327 | $496 | $6,831 |
| 2015 | $2,642 | $7,327 | $496 | $6,831 |
| 2014 | $2,455 | $7,327 | $496 | $6,831 |
| 2013 | $2,923 | $8,982 | $496 | $8,486 |
Source: Public Records
Map
Nearby Homes
- 415 S East Ave
- 415 Wesley Ave Unit 21
- 415 Wesley Ave Unit 36
- 415 Wesley Ave Unit 24
- 510 Madison St Unit 1N
- 510 Madison St Unit 3S
- 512 Madison St Unit 1S
- 508 Madison St Unit 2S
- 315 S Scoville Ave
- 444 Washington Blvd Unit 404
- 444 Washington Blvd Unit 207
- 514 Wesley Ave
- 331 S Ridgeland Ave Unit B
- 603 Wesley Ave
- 224 S Oak Park Ave Unit 1B
- 820 Washington Blvd Unit G
- 229 S Ridgeland Ave
- 839 Madison St Unit 207
- 839 Madison St Unit 307
- 839 Madison St Unit 301
- 419 S East Ave Unit 1C
- 419 S East Ave Unit 2C
- 419 S East Ave Unit 3A
- 419 S East Ave Unit 1A
- 419 S East Ave Unit 2B
- 419 S East Ave Unit 3C
- 419 S East Ave Unit 2D
- 419 S East Ave Unit 2A
- 419 S East Ave Unit 1B
- 423 S East Ave
- 413 S East Ave
- 411 S East Ave
- 417 S East Ave
- 417 S East Ave Unit 417
- 409 S East Ave
- 609 Washington Blvd Unit 2W
- 609 Washington Blvd Unit 6092
- 609 Washington Blvd Unit 6093
- 609 Washington Blvd Unit 6091
- 609 Washington Blvd Unit 6092