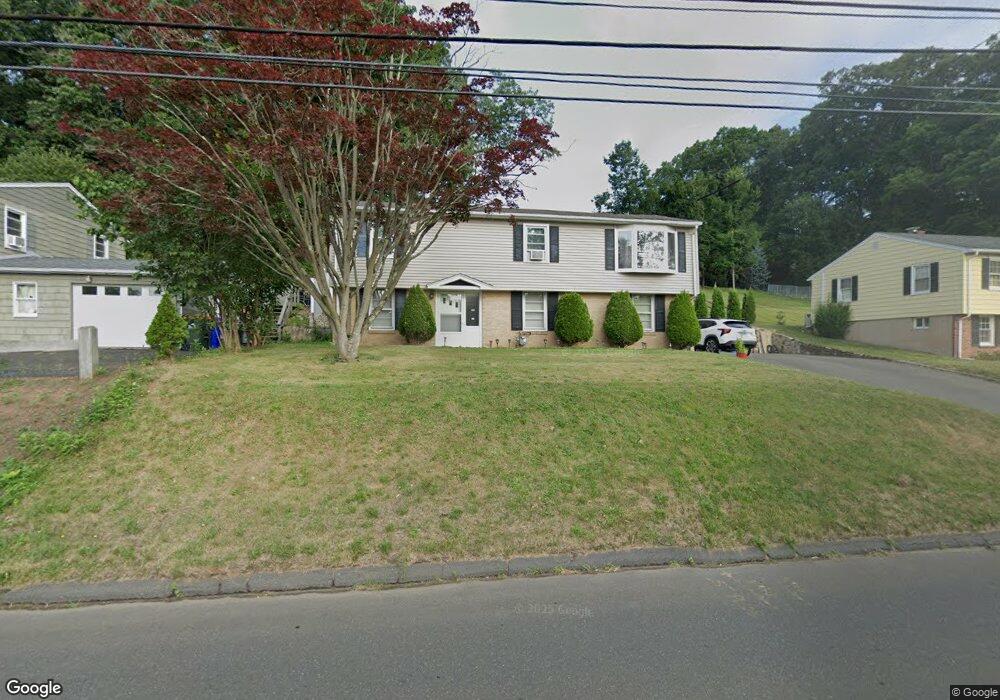
419 S Elm St Wallingford, CT 06492
Estimated Value: $341,000 - $373,000
3
Beds
2
Baths
1,144
Sq Ft
$313/Sq Ft
Est. Value
About This Home
This home is located at 419 S Elm St, Wallingford, CT 06492 and is currently estimated at $358,447, approximately $313 per square foot. 419 S Elm St is a home located in New Haven County with nearby schools including Evarts C. Stevens School, Pond Hill Elementary School, and Dag Hammarskjold Middle School.
Ownership History
Date
Name
Owned For
Owner Type
Purchase Details
Closed on
Jan 14, 2015
Sold by
Shah Ritesh H
Bought by
Shah Ritesh H and Shah Kinnariben
Current Estimated Value
Purchase Details
Closed on
Dec 17, 2013
Sold by
Dagliere Richard
Bought by
Shah Ritesh H
Home Financials for this Owner
Home Financials are based on the most recent Mortgage that was taken out on this home.
Original Mortgage
$155,550
Interest Rate
4.14%
Purchase Details
Closed on
Dec 3, 2009
Sold by
Brondino Paul M and Moscato-Delmastro Lynn
Bought by
Sperl Michael J and Murphy Ellen E
Purchase Details
Closed on
Nov 1, 2004
Sold by
Narowski Jerzy Z
Bought by
Dagliere Richard
Purchase Details
Closed on
May 30, 2000
Sold by
Est Gancy Maria and Moore Kieren M
Bought by
Narowski Jerzy Z
Create a Home Valuation Report for This Property
The Home Valuation Report is an in-depth analysis detailing your home's value as well as a comparison with similar homes in the area
Home Values in the Area
Average Home Value in this Area
Purchase History
| Date | Buyer | Sale Price | Title Company |
|---|---|---|---|
| Shah Ritesh H | -- | -- | |
| Shah Ritesh H | $183,000 | -- | |
| Sperl Michael J | $289,900 | -- | |
| Dagliere Richard | $210,000 | -- | |
| Narowski Jerzy Z | $110,000 | -- | |
| Shah Ritesh H | -- | -- | |
| Shah Ritesh H | $183,000 | -- | |
| Sperl Michael J | $289,900 | -- | |
| Dagliere Richard | $210,000 | -- | |
| Narowski Jerzy Z | $110,000 | -- |
Source: Public Records
Mortgage History
| Date | Status | Borrower | Loan Amount |
|---|---|---|---|
| Open | Narowski Jerzy Z | $34,000 | |
| Previous Owner | Narowski Jerzy Z | $155,550 |
Source: Public Records
Tax History Compared to Growth
Tax History
| Year | Tax Paid | Tax Assessment Tax Assessment Total Assessment is a certain percentage of the fair market value that is determined by local assessors to be the total taxable value of land and additions on the property. | Land | Improvement |
|---|---|---|---|---|
| 2025 | $5,591 | $231,800 | $93,400 | $138,400 |
| 2024 | $5,206 | $169,800 | $82,300 | $87,500 |
| 2023 | $4,982 | $169,800 | $82,300 | $87,500 |
| 2022 | $4,931 | $169,800 | $82,300 | $87,500 |
| 2021 | $4,843 | $169,800 | $82,300 | $87,500 |
| 2020 | $5,210 | $178,500 | $88,300 | $90,200 |
| 2019 | $5,210 | $178,500 | $88,300 | $90,200 |
| 2018 | $5,112 | $178,500 | $88,300 | $90,200 |
| 2017 | $5,096 | $178,500 | $88,300 | $90,200 |
| 2016 | $4,978 | $178,500 | $88,300 | $90,200 |
| 2015 | $4,906 | $178,600 | $88,400 | $90,200 |
| 2014 | $4,803 | $178,600 | $88,400 | $90,200 |
Source: Public Records
Map
Nearby Homes
- 120 Grandview Ave
- 333 S Elm St
- 91 Pond Hill Rd
- 210 S Elm St
- 341 Long Hill Rd
- 180 S Whittlesey Ave
- 6 Holly Ln
- 15 Marshall St
- 109 Clifton St
- 32 Brian Rd
- 120 S Cherry St
- 67 Spring St
- 39 Hoffman Ct Unit B3
- 26 West St
- 530 Center St Unit C1
- 148 Judd Square Unit 148
- 513 Pilgrim Harbor
- 43 Academy St
- 29 Curtis Ave
- 85 N Colony St