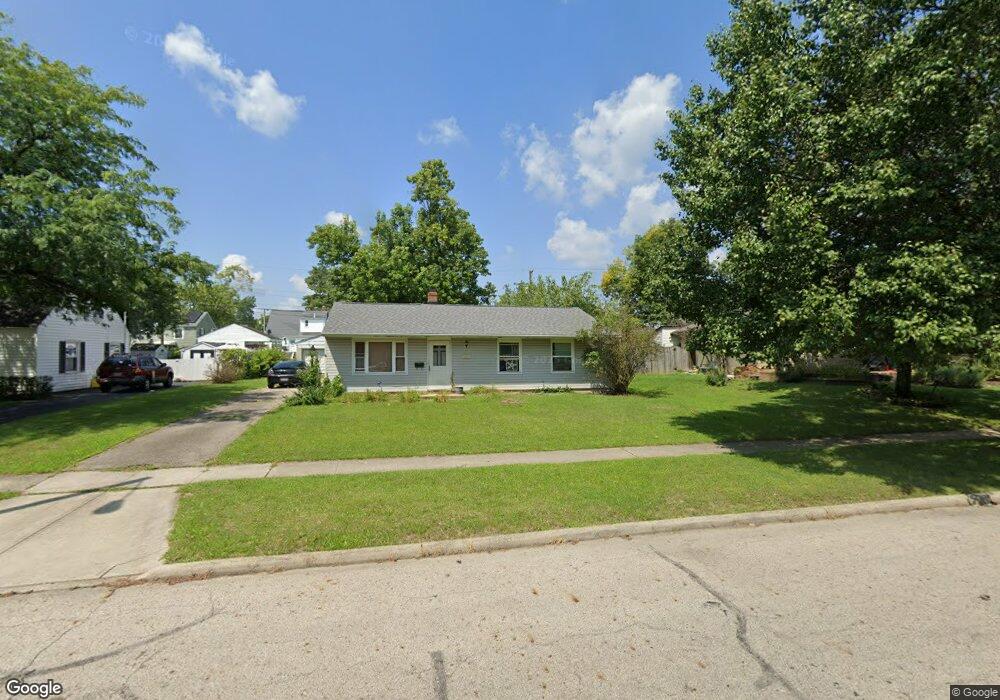
419 Sturbridge Rd Columbus, OH 43228
Estimated Value: $172,000 - $262,000
3
Beds
2
Baths
1,443
Sq Ft
$151/Sq Ft
Est. Value
About This Home
This home is located at 419 Sturbridge Rd, Columbus, OH 43228 and is currently estimated at $218,433, approximately $151 per square foot. 419 Sturbridge Rd is a home located in Franklin County with nearby schools including Prairie Lincoln Elementary School, Galloway Ridge Intermediate School, and Norton Middle School.
Ownership History
Date
Name
Owned For
Owner Type
Purchase Details
Closed on
Jun 18, 2010
Sold by
Tweed William H and Little Carolyn
Bought by
Bergholz Desiree
Current Estimated Value
Home Financials for this Owner
Home Financials are based on the most recent Mortgage that was taken out on this home.
Original Mortgage
$71,000
Outstanding Balance
$46,849
Interest Rate
4.97%
Mortgage Type
New Conventional
Estimated Equity
$171,584
Purchase Details
Closed on
May 24, 2000
Sold by
Babb Michael D
Bought by
Tweed William H and Tweed Agnes A
Purchase Details
Closed on
May 3, 1996
Sold by
Knox Jay E
Bought by
Michael D Babb
Home Financials for this Owner
Home Financials are based on the most recent Mortgage that was taken out on this home.
Original Mortgage
$82,975
Interest Rate
7.86%
Mortgage Type
FHA
Purchase Details
Closed on
Jun 1, 1983
Create a Home Valuation Report for This Property
The Home Valuation Report is an in-depth analysis detailing your home's value as well as a comparison with similar homes in the area
Home Values in the Area
Average Home Value in this Area
Purchase History
| Date | Buyer | Sale Price | Title Company |
|---|---|---|---|
| Bergholz Desiree | $71,000 | Independent | |
| Tweed William H | $98,000 | Title First Agency Inc | |
| Michael D Babb | $84,900 | -- | |
| -- | $52,900 | -- |
Source: Public Records
Mortgage History
| Date | Status | Borrower | Loan Amount |
|---|---|---|---|
| Open | Bergholz Desiree | $71,000 | |
| Previous Owner | Michael D Babb | $82,975 |
Source: Public Records
Tax History
| Year | Tax Paid | Tax Assessment Tax Assessment Total Assessment is a certain percentage of the fair market value that is determined by local assessors to be the total taxable value of land and additions on the property. | Land | Improvement |
|---|---|---|---|---|
| 2025 | $2,932 | $64,300 | $18,130 | $46,170 |
| 2024 | $2,932 | $64,300 | $18,130 | $46,170 |
| 2023 | $2,807 | $64,295 | $18,130 | $46,165 |
| 2022 | $2,555 | $41,060 | $4,240 | $36,820 |
| 2021 | $2,596 | $41,060 | $4,240 | $36,820 |
| 2020 | $2,573 | $41,060 | $4,240 | $36,820 |
| 2019 | $2,537 | $35,360 | $3,540 | $31,820 |
| 2018 | $2,390 | $35,360 | $3,540 | $31,820 |
| 2017 | $2,323 | $35,360 | $3,540 | $31,820 |
| 2016 | $2,251 | $30,320 | $6,900 | $23,420 |
| 2015 | $2,251 | $30,320 | $6,900 | $23,420 |
| 2014 | $2,216 | $30,320 | $6,900 | $23,420 |
| 2013 | $1,303 | $35,665 | $8,120 | $27,545 |
Source: Public Records
Map
Nearby Homes
- 389 Deerfield Rd
- 4899 Hamden Way
- 396 Pasadena Ave
- 463 Darbyhurst Rd
- 381 Pasadena Ave
- 443 Lawrence Ave
- 495 Lennox Ave
- 305 Danhurst Rd
- 417 Revere Ct
- 348 Darbyhurst Rd
- 199 N Murray Hill Rd
- 399 Carilla Ln
- 464 Yarmouth Ln
- 97 Tarryton Ct W Unit 19-H
- 87 Tarryton Ct W Unit 18D
- 218 Darbyhurst Rd
- 4696 Tarryton Ct S Unit 7-3F
- 4723 Tarryton Ct S Unit 14-E
- 69 Lawrence Ave
- 110 Inah Ave
- 411 Sturbridge Rd
- 425 Sturbridge Rd
- 436 Deerfield Rd
- 403 Sturbridge Rd
- 428 Deerfield Rd
- 442 Deerfield Rd
- 420 Deerfield Rd
- 450 Deerfield Rd
- 429 Sturbridge Rd
- 420 Sturbridge Rd
- 395 Sturbridge Rd
- 433 Powder Mill Ln
- 412 Deerfield Rd
- 463 Powder Mill Ln
- 460 Deerfield Rd
- 402 Sturbridge Rd
- 402 Deerfield Rd
- 387 Sturbridge Rd
- 394 Sturbridge Rd
- 473 Powder Mill Ln
Your Personal Tour Guide
Ask me questions while you tour the home.