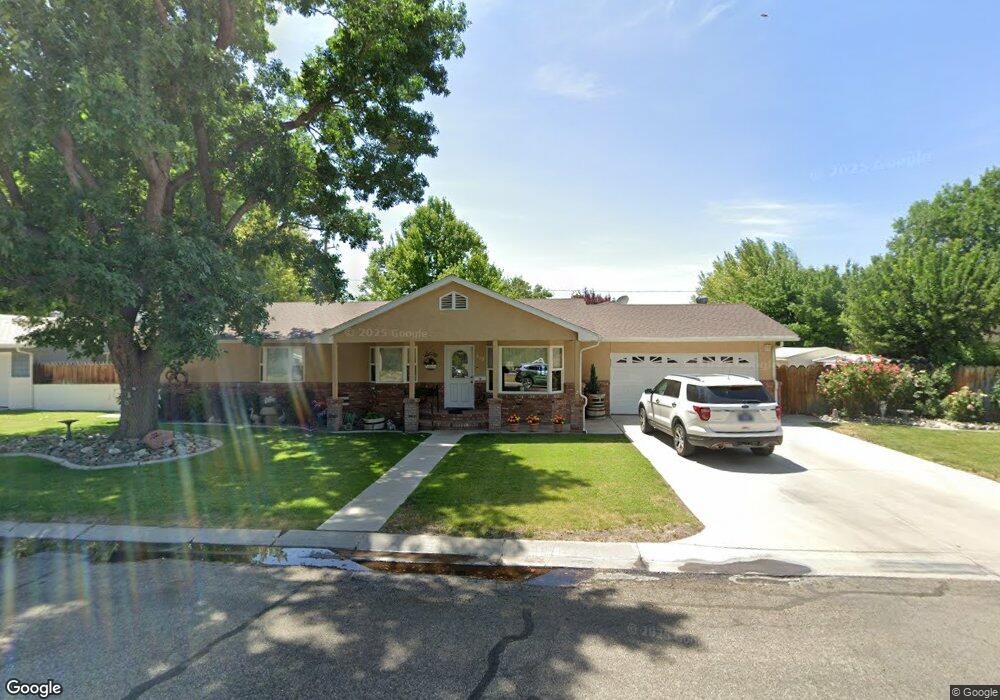
419 Tibbals Way Yerington, NV 89447
Estimated Value: $285,000 - $344,000
4
Beds
2
Baths
1,996
Sq Ft
$156/Sq Ft
Est. Value
About This Home
This home is located at 419 Tibbals Way, Yerington, NV 89447 and is currently estimated at $312,049, approximately $156 per square foot. 419 Tibbals Way is a home located in Lyon County with nearby schools including Yerington Elementary School, Yerington Intermediate School, and Yerington High School.
Create a Home Valuation Report for This Property
The Home Valuation Report is an in-depth analysis detailing your home's value as well as a comparison with similar homes in the area
Home Values in the Area
Average Home Value in this Area
Tax History Compared to Growth
Tax History
| Year | Tax Paid | Tax Assessment Tax Assessment Total Assessment is a certain percentage of the fair market value that is determined by local assessors to be the total taxable value of land and additions on the property. | Land | Improvement |
|---|---|---|---|---|
| 2025 | $1,222 | $59,067 | $31,500 | $27,567 |
| 2024 | $1,186 | $58,687 | $31,500 | $27,187 |
| 2023 | $1,186 | $64,146 | $39,200 | $24,946 |
| 2022 | $1,118 | $63,100 | $39,200 | $23,900 |
| 2021 | $1,086 | $29,661 | $5,600 | $24,061 |
| 2020 | $1,072 | $29,289 | $5,600 | $23,689 |
| 2019 | $1,065 | $29,098 | $5,600 | $23,498 |
| 2018 | $1,035 | $28,290 | $4,760 | $23,530 |
| 2017 | $1,056 | $28,849 | $4,760 | $24,089 |
| 2016 | $1,095 | $30,394 | $4,760 | $25,634 |
| 2015 | $1,112 | $30,718 | $4,760 | $25,958 |
| 2014 | $1,107 | $30,682 | $4,760 | $25,922 |
Source: Public Records
Map
Nearby Homes
- 311 S Main St
- 616 S Center St
- 329 S West St
- 321 S West St
- 234 S West St
- 41 Nevada 208
- 0 Nevada 208
- 13ac S Whitacre St
- 9 N Nevada St
- 0 S Whitacre St Unit 250001435
- 411 Paul Ave
- 416 Paul Ave
- 317 Modesto St
- 104 Virginia St
- 115 Commercial Ave
- 200 Quail Run Dr
- 307 Niblick Ct
- 244 Valley Dr
- 204 Quail Run Dr
- 907 S Whitacre St
- 425 Tibbals Way
- 411 Tibbals Way
- 418 Shipley Dr
- 418 Tibbals Way
- 412 Shipley Dr
- 426 Shipley Dr
- 426 Tibbals Way
- 412 Tibbals Way
- 433 Tibbals Way
- 403 Tibbals Way
- 404 Shipley Dr
- 434 Shipley Dr
- 434 Tibbals Way
- 406 Tibbals Way
- 419 S California St
- 411 S California St
- 427 S California St
- 419 Shipley Dr
- 441 Tibbals Way
- 427 Shipley Dr