Estimated Value: $65,460 - $119,000
--
Bed
2
Baths
864
Sq Ft
$114/Sq Ft
Est. Value
About This Home
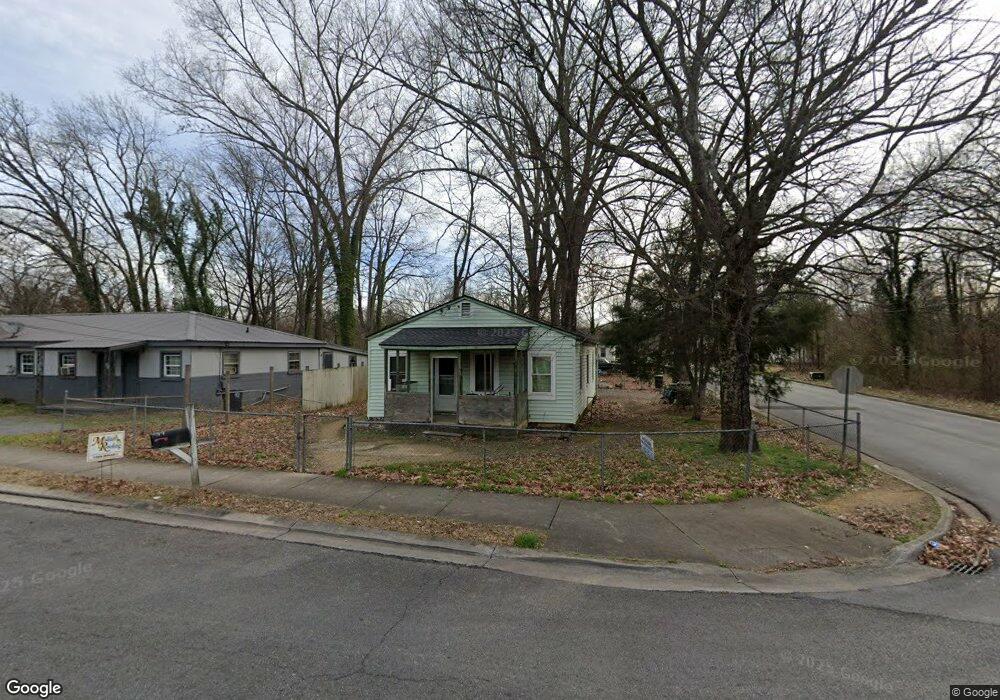
This home is located at 419 Wilson Ave SW, Rome, GA 30161 and is currently estimated at $98,365, approximately $113 per square foot. 419 Wilson Ave SW is a home located in Floyd County with nearby schools including Dan McCarty Middle School, Rome High School, and Darlington School.
Ownership History
Date
Name
Owned For
Owner Type
Purchase Details
Closed on
Feb 2, 2018
Sold by
F & W Redevelopment Llc
Bought by
Neal Donald
Current Estimated Value
Purchase Details
Closed on
Mar 8, 2004
Sold by
Bank Of New York The Trustee For Eqcc Tr
Bought by
F&W Redevelopment Llc
Purchase Details
Closed on
Aug 5, 2003
Sold by
Orr Theodore and Mary Orr
Bought by
Bank Of New York The Trustee For Eqcc Tr
Purchase Details
Closed on
Jul 23, 1998
Sold by
Orr Theodore
Bought by
Orr Theodore and Mary Orr
Purchase Details
Closed on
Oct 30, 1996
Sold by
Cooper Rena H
Bought by
Orr Theodore
Purchase Details
Closed on
Apr 22, 1992
Sold by
Cooper John S
Bought by
Cooper Rena H
Purchase Details
Closed on
Aug 30, 1983
Sold by
Smith Lumber Compamy J P Inc
Bought by
Cooper John S
Purchase Details
Closed on
Oct 3, 1977
Sold by
Moore Doyle A
Bought by
Pine Log Land Co
Purchase Details
Closed on
Jan 1, 1901
Bought by
Moore Doyle A
Create a Home Valuation Report for This Property
The Home Valuation Report is an in-depth analysis detailing your home's value as well as a comparison with similar homes in the area
Home Values in the Area
Average Home Value in this Area
Purchase History
| Date | Buyer | Sale Price | Title Company |
|---|---|---|---|
| Neal Donald | -- | -- | |
| F&W Redevelopment Llc | $15,500 | -- | |
| Bank Of New York The Trustee For Eqcc Tr | $21,300 | -- | |
| Orr Theodore | -- | -- | |
| Orr Theodore | -- | -- | |
| Cooper Rena H | -- | -- | |
| Cooper John S | -- | -- | |
| Smith Lumber Compamy J P Inc | $50,800 | -- | |
| Pine Log Land Co | $5,000 | -- | |
| Moore Doyle A | -- | -- |
Source: Public Records
Tax History Compared to Growth
Tax History
| Year | Tax Paid | Tax Assessment Tax Assessment Total Assessment is a certain percentage of the fair market value that is determined by local assessors to be the total taxable value of land and additions on the property. | Land | Improvement |
|---|---|---|---|---|
| 2024 | $442 | $15,872 | $4,400 | $11,472 |
| 2023 | $440 | $14,416 | $4,000 | $10,416 |
| 2022 | $382 | $11,768 | $3,200 | $8,568 |
| 2021 | $337 | $9,095 | $3,200 | $5,895 |
| 2020 | $301 | $8,035 | $2,500 | $5,535 |
| 2019 | $284 | $7,674 | $2,500 | $5,174 |
| 2018 | $269 | $7,277 | $2,500 | $4,777 |
| 2017 | $262 | $7,064 | $2,500 | $4,564 |
| 2016 | $315 | $8,487 | $2,480 | $6,007 |
| 2015 | -- | $8,487 | $2,480 | $6,007 |
| 2014 | -- | $8,487 | $2,480 | $6,007 |
Source: Public Records
Map
Nearby Homes
- 410 Hardy Ave SW
- 3 Porter St SW
- 3 Grover St SW
- 529 Branham Ave SW
- 218 Wilson Ave SW
- 334 Branham Ave SW
- 107 Butler St SW
- 515 Harper Ave SW
- 110 Cherokee St SW
- 18 Butler St SW
- 101 Hardy Ave SW
- 111 Lookout Cir SW
- 113 Lookout Cir SW
- 515 S Broad St SW
- 115 Lookout Cir SW
- 105 Mary St SW
- 204 Myrtle St SW
- 232 S Broad St SW
- 304 Grover St SW
- 415 Wilson Ave SW
- 413 Wilson Ave SW
- 309 Grover St SW
- 302 Grover St SW
- 301 Grover St SW
- 420 Wilson Ave SW
- 505 Wilson Ave SW
- 411 Wilson Ave SW
- 418 Wilson Ave SW
- 416 Wilson Ave SW
- 500 Wilson Ave SW
- 414 Wilson Ave SW
- 507 Wilson Ave SW
- 409 Wilson Ave SW
- 504 Nixon Ave SW
- 410 Nixon Ave SW
- 412 Wilson Ave SW
- 506 Nixon Ave SW
- 407 Wilson Ave SW