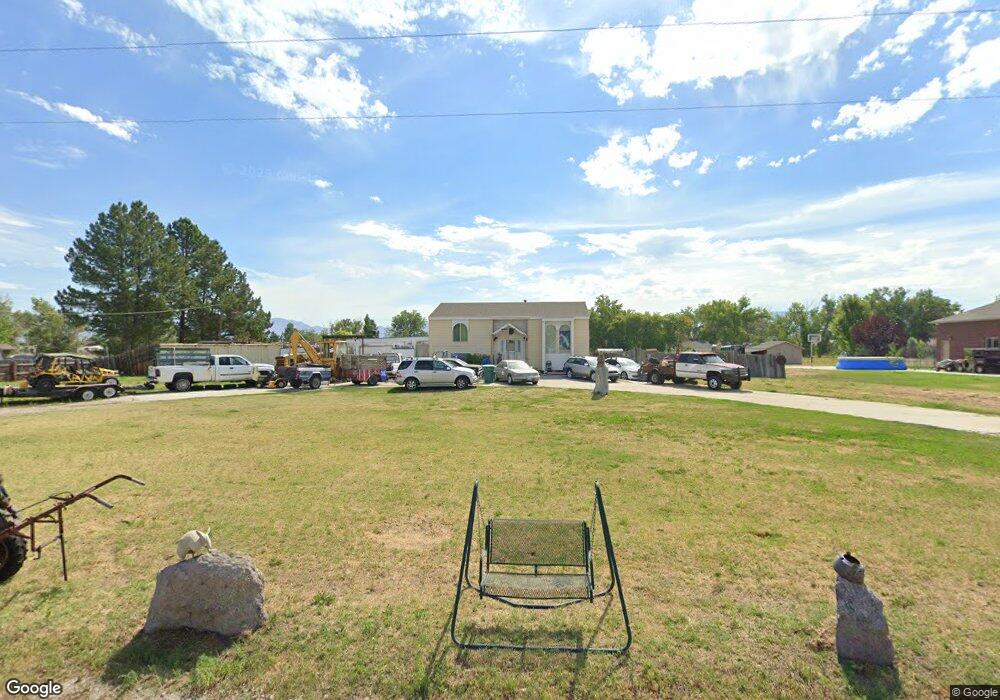
4190 S 5350 W Hooper, UT 84315
Estimated Value: $578,000 - $625,000
4
Beds
3
Baths
1,102
Sq Ft
$545/Sq Ft
Est. Value
About This Home
This home is located at 4190 S 5350 W, Hooper, UT 84315 and is currently estimated at $600,868, approximately $545 per square foot. 4190 S 5350 W is a home located in Weber County with nearby schools including Hooper Elementary School, Rocky Mountain Junior High School, and Quest Academy.
Ownership History
Date
Name
Owned For
Owner Type
Purchase Details
Closed on
Jan 6, 1999
Sold by
Silcox Carl D
Bought by
Silcox Carl D and Silcox Melanie C
Current Estimated Value
Home Financials for this Owner
Home Financials are based on the most recent Mortgage that was taken out on this home.
Original Mortgage
$127,301
Outstanding Balance
$29,450
Interest Rate
6.73%
Mortgage Type
FHA
Estimated Equity
$571,418
Create a Home Valuation Report for This Property
The Home Valuation Report is an in-depth analysis detailing your home's value as well as a comparison with similar homes in the area
Home Values in the Area
Average Home Value in this Area
Purchase History
| Date | Buyer | Sale Price | Title Company |
|---|---|---|---|
| Silcox Carl D | -- | Associated Title | |
| Silcox Carl D | -- | Bonneville Title Company |
Source: Public Records
Mortgage History
| Date | Status | Borrower | Loan Amount |
|---|---|---|---|
| Open | Silcox Carl D | $127,301 |
Source: Public Records
Tax History
| Year | Tax Paid | Tax Assessment Tax Assessment Total Assessment is a certain percentage of the fair market value that is determined by local assessors to be the total taxable value of land and additions on the property. | Land | Improvement |
|---|---|---|---|---|
| 2025 | $3,079 | $524,052 | $247,586 | $276,466 |
| 2024 | $2,976 | $296,343 | $148,592 | $147,751 |
| 2023 | $2,629 | $259,479 | $148,592 | $110,887 |
| 2022 | $2,734 | $263,450 | $122,430 | $141,020 |
| 2021 | $2,270 | $376,000 | $118,805 | $257,195 |
| 2020 | $2,099 | $317,000 | $103,808 | $213,192 |
| 2019 | $2,010 | $286,000 | $78,890 | $207,110 |
| 2018 | $1,797 | $243,000 | $78,890 | $164,110 |
| 2017 | $1,628 | $214,999 | $75,350 | $139,649 |
| 2016 | $1,644 | $122,080 | $37,850 | $84,230 |
| 2015 | $1,575 | $115,367 | $35,148 | $80,219 |
| 2014 | $1,479 | $105,516 | $35,148 | $70,368 |
Source: Public Records
Map
Nearby Homes
- 4111 S 5350 W
- 5800 W 4050 S
- 5345 W 4000 S
- 5478 W 3750 S
- 3842 S 5675 W
- 4129 S 5800 W Unit 4
- 4146 S 5800 W Unit 5
- 4194 S 5800 W Unit 14
- 4168 S 5800 W Unit 12
- 4179 S 5800 W Unit 1
- 4163 S 5800 W Unit 2
- 3245 S 4975 W Unit 13
- 3223 S 4975 W Unit 15
- 3257 S 4975 W Unit 12
- 3269 S 4975 W Unit 11
- 3729 S 5600 W Unit 6
- 3672 S 5600 W Unit 23
- 3720 S 5600 W Unit 2
- 3732 S 5600 W Unit 3
- 3719 S 5600 W Unit 7
Your Personal Tour Guide
Ask me questions while you tour the home.