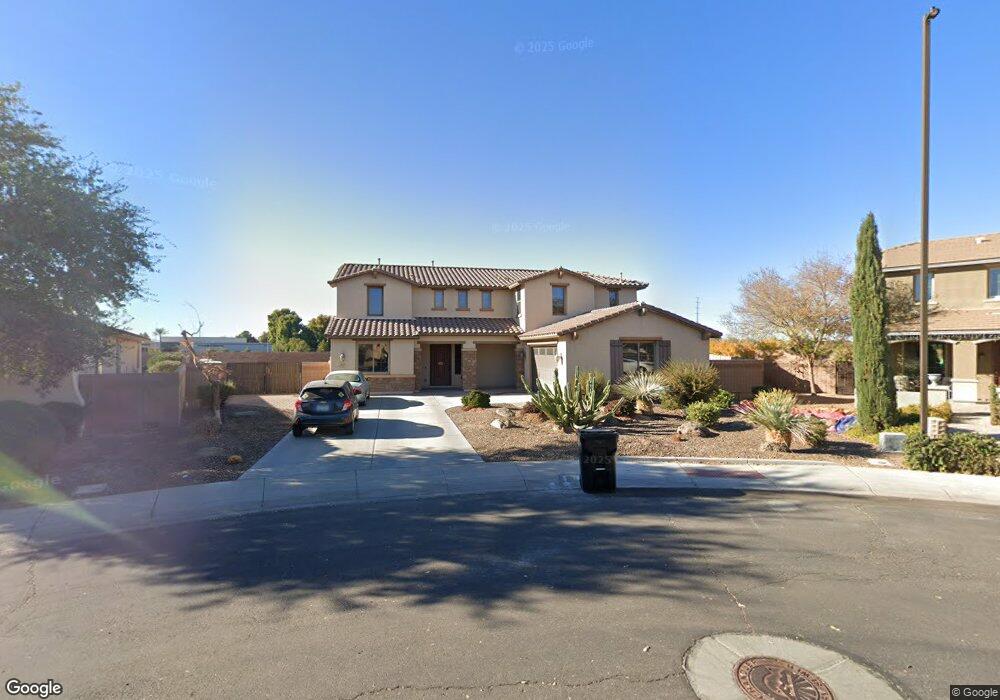
4190 S Jesse St Chandler, AZ 85249
South Chandler NeighborhoodEstimated Value: $866,119 - $1,056,000
--
Bed
4
Baths
3,698
Sq Ft
$257/Sq Ft
Est. Value
About This Home
This home is located at 4190 S Jesse St, Chandler, AZ 85249 and is currently estimated at $951,780, approximately $257 per square foot. 4190 S Jesse St is a home located in Maricopa County.
Ownership History
Date
Name
Owned For
Owner Type
Purchase Details
Closed on
Dec 3, 2010
Sold by
Fulton Homes Sales Corporation
Bought by
Rasheed Rizwan A
Current Estimated Value
Home Financials for this Owner
Home Financials are based on the most recent Mortgage that was taken out on this home.
Original Mortgage
$354,000
Outstanding Balance
$233,404
Interest Rate
4.18%
Mortgage Type
FHA
Estimated Equity
$718,376
Create a Home Valuation Report for This Property
The Home Valuation Report is an in-depth analysis detailing your home's value as well as a comparison with similar homes in the area
Home Values in the Area
Average Home Value in this Area
Purchase History
| Date | Buyer | Sale Price | Title Company |
|---|---|---|---|
| Rasheed Rizwan A | $385,782 | Security Title Agency | |
| Futlon Homes Sales Corporation | $291,222 | Security Title Agency |
Source: Public Records
Mortgage History
| Date | Status | Borrower | Loan Amount |
|---|---|---|---|
| Open | Rasheed Rizwan A | $354,000 |
Source: Public Records
Tax History Compared to Growth
Tax History
| Year | Tax Paid | Tax Assessment Tax Assessment Total Assessment is a certain percentage of the fair market value that is determined by local assessors to be the total taxable value of land and additions on the property. | Land | Improvement |
|---|---|---|---|---|
| 2025 | $4,978 | $58,581 | -- | -- |
| 2024 | $4,787 | $55,792 | -- | -- |
| 2023 | $4,787 | $67,470 | $13,490 | $53,980 |
| 2022 | $4,620 | $53,960 | $10,790 | $43,170 |
| 2021 | $4,746 | $49,830 | $9,960 | $39,870 |
| 2020 | $4,713 | $45,900 | $9,180 | $36,720 |
| 2019 | $4,541 | $43,810 | $8,760 | $35,050 |
| 2018 | $4,486 | $43,430 | $8,680 | $34,750 |
| 2017 | $4,183 | $40,630 | $8,120 | $32,510 |
| 2016 | $4,020 | $41,250 | $8,250 | $33,000 |
| 2015 | $3,823 | $40,700 | $8,140 | $32,560 |
Source: Public Records