Estimated Value: $271,000 - $407,149
3
Beds
2
Baths
1,280
Sq Ft
$274/Sq Ft
Est. Value
About This Home
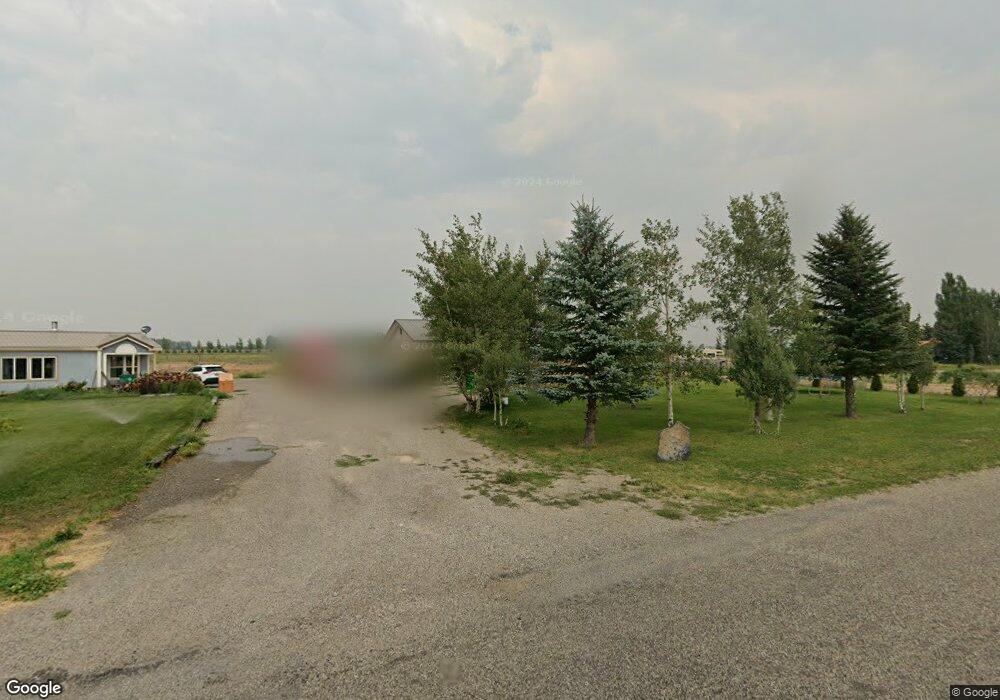
This home is located at 4191 E 100 N, Rigby, ID 83442 and is currently estimated at $350,537, approximately $273 per square foot. 4191 E 100 N is a home located in Jefferson County with nearby schools including South Fork Elementary School, Rigby Middle School, and Rigby High School.
Ownership History
Date
Name
Owned For
Owner Type
Purchase Details
Closed on
Sep 10, 2010
Sold by
Alejo Florencio
Bought by
Galaviz Luz Estela
Current Estimated Value
Home Financials for this Owner
Home Financials are based on the most recent Mortgage that was taken out on this home.
Original Mortgage
$88,804
Outstanding Balance
$61,746
Interest Rate
5.75%
Mortgage Type
FHA
Estimated Equity
$288,791
Purchase Details
Closed on
Feb 25, 2009
Sold by
Andrade Raymundo
Bought by
Alejo Florencio
Purchase Details
Closed on
Aug 18, 2008
Sold by
Alejo Florencio and Pulido Aldolfina A
Bought by
Andrade Raymundo
Home Financials for this Owner
Home Financials are based on the most recent Mortgage that was taken out on this home.
Original Mortgage
$9,000
Interest Rate
6.27%
Mortgage Type
Purchase Money Mortgage
Purchase Details
Closed on
Jan 11, 2008
Sold by
Alejo Florencio
Bought by
Alejo Florencio and Pulido Oldolfina A
Create a Home Valuation Report for This Property
The Home Valuation Report is an in-depth analysis detailing your home's value as well as a comparison with similar homes in the area
Purchase History
| Date | Buyer | Sale Price | Title Company |
|---|---|---|---|
| Galaviz Luz Estela | -- | -- | |
| Alejo Florencio | -- | -- | |
| Andrade Raymundo | -- | -- | |
| Alejo Florencio | -- | -- | |
| Alejo Florencio | -- | -- | |
| Alejo Florencio | -- | -- |
Source: Public Records
Mortgage History
| Date | Status | Borrower | Loan Amount |
|---|---|---|---|
| Open | Galaviz Luz Estela | $88,804 | |
| Previous Owner | Andrade Raymundo | $9,000 |
Source: Public Records
Tax History
| Year | Tax Paid | Tax Assessment Tax Assessment Total Assessment is a certain percentage of the fair market value that is determined by local assessors to be the total taxable value of land and additions on the property. | Land | Improvement |
|---|---|---|---|---|
| 2025 | $385 | $222,900 | $0 | $0 |
| 2024 | $385 | $201,598 | $0 | $0 |
| 2023 | $519 | $197,221 | $0 | $0 |
| 2022 | $728 | $179,590 | $0 | $0 |
| 2021 | $789 | $148,504 | $0 | $0 |
| 2020 | $626 | $138,285 | $0 | $0 |
| 2019 | $664 | $111,868 | $0 | $0 |
| 2018 | $672 | $107,248 | $0 | $0 |
| 2017 | $682 | $105,248 | $0 | $0 |
| 2016 | $690 | $54,415 | $0 | $0 |
| 2015 | $713 | $54,444 | $0 | $0 |
| 2014 | $683 | $51,618 | $0 | $0 |
| 2013 | -- | $51,618 | $0 | $0 |
Source: Public Records
Map
Nearby Homes
Your Personal Tour Guide
Ask me questions while you tour the home.