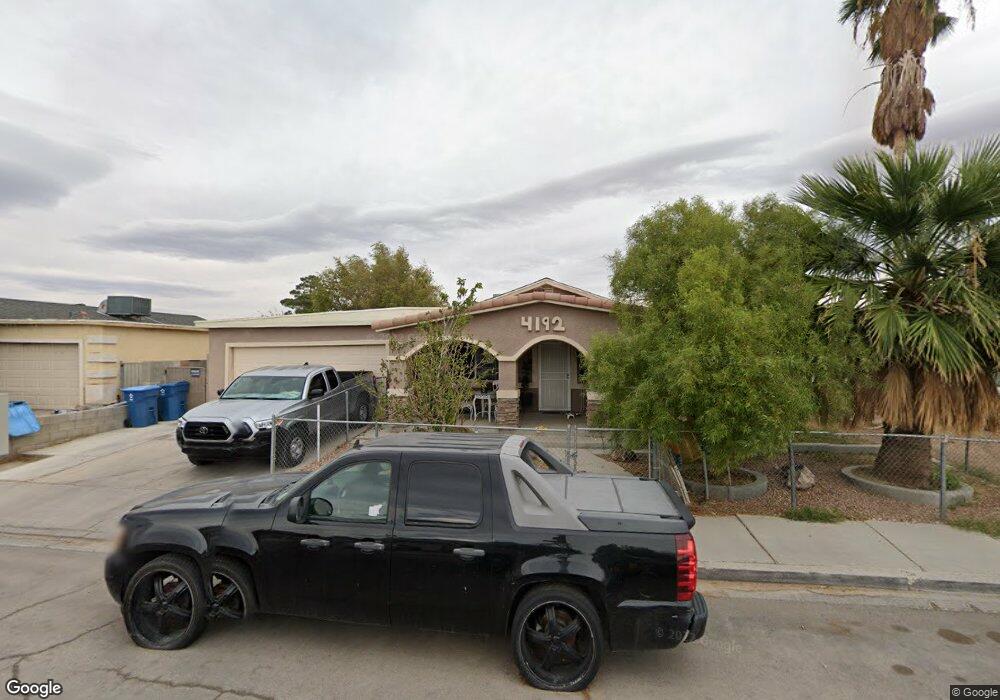
4192 Paramount St Unit 3 Las Vegas, NV 89115
Estimated Value: $328,000 - $357,000
3
Beds
2
Baths
1,196
Sq Ft
$282/Sq Ft
Est. Value
About This Home
This home is located at 4192 Paramount St Unit 3, Las Vegas, NV 89115 and is currently estimated at $337,664, approximately $282 per square foot. 4192 Paramount St Unit 3 is a home located in Clark County with nearby schools including J.E. Manch Elementary School, Zel & Mary Lowman Elementary School, and Carroll M. Johnston STEM Academy of Environmental Studies.
Ownership History
Date
Name
Owned For
Owner Type
Purchase Details
Closed on
Jun 13, 2016
Sold by
Cervantes Lissandra
Bought by
Cervantes Tovias and Cervantes Gloria
Current Estimated Value
Purchase Details
Closed on
Feb 24, 2011
Sold by
Garibay Bernardino M and Garibay Magdalena Gallegos
Bought by
Cervantes Lissandra
Purchase Details
Closed on
Feb 10, 1995
Sold by
Johnsen Beverly A
Bought by
Garibay Bernardino M and Garibay Magdalena Gallegos
Home Financials for this Owner
Home Financials are based on the most recent Mortgage that was taken out on this home.
Original Mortgage
$53,068
Interest Rate
9.27%
Mortgage Type
Seller Take Back
Create a Home Valuation Report for This Property
The Home Valuation Report is an in-depth analysis detailing your home's value as well as a comparison with similar homes in the area
Home Values in the Area
Average Home Value in this Area
Purchase History
| Date | Buyer | Sale Price | Title Company |
|---|---|---|---|
| Cervantes Tovias | -- | None Available | |
| Cervantes Lissandra | $45,000 | Fidelity National Title Las | |
| Garibay Bernardino M | $21,500 | Land Title |
Source: Public Records
Mortgage History
| Date | Status | Borrower | Loan Amount |
|---|---|---|---|
| Previous Owner | Garibay Bernardino M | $53,068 | |
| Closed | Garibay Bernardino M | $1,000 |
Source: Public Records
Tax History Compared to Growth
Tax History
| Year | Tax Paid | Tax Assessment Tax Assessment Total Assessment is a certain percentage of the fair market value that is determined by local assessors to be the total taxable value of land and additions on the property. | Land | Improvement |
|---|---|---|---|---|
| 2025 | $680 | $49,150 | $27,650 | $21,500 |
| 2024 | $631 | $49,150 | $27,650 | $21,500 |
| 2023 | $631 | $48,141 | $26,950 | $21,191 |
| 2022 | $584 | $40,155 | $20,300 | $19,855 |
| 2021 | $541 | $38,434 | $19,250 | $19,184 |
| 2020 | $500 | $36,923 | $17,500 | $19,423 |
| 2019 | $468 | $34,535 | $15,050 | $19,485 |
| 2018 | $447 | $31,226 | $12,250 | $18,976 |
| 2017 | $879 | $29,980 | $10,500 | $19,480 |
| 2016 | $420 | $27,223 | $7,000 | $20,223 |
| 2015 | $418 | $19,647 | $3,850 | $15,797 |
| 2014 | $404 | $16,170 | $3,500 | $12,670 |
Source: Public Records
Map
Nearby Homes
- 4219 Studio St
- 4195 Story Rock St
- 4027 Boratko St
- 4676 E Alexander Rd
- 4759 Pinon Pointe Rd
- 4329 Studio St
- 4774 Valleyside Ave
- 4305 Puebla St
- 4004 Emerald Wood St
- 4278 Lemay St Unit 2
- 3958 Blushing Hearts Rd
- 3926 Tatiana St
- 4409 Shalimar Ave
- 3895 Tatiana St
- 4730 E Craig Rd Unit 1020
- 4730 E Craig Rd Unit 2096
- 4730 E Craig Rd Unit 2180
- 4730 E Craig Rd Unit 2115
- 4730 E Craig Rd Unit 2163
- 4730 E Craig Rd Unit 2093
- 4182 Paramount St
- 4202 Paramount St
- 4191 Calimesa St
- 4201 Calimesa St
- 4172 Paramount St
- 4181 Calimesa St Unit 2
- 4211 Calimesa St
- 4183 Paramount St
- 4193 Paramount St
- 4171 Calimesa St
- 4203 Paramount St
- 4162 Paramount St
- 4222 Paramount St
- 4173 Paramount St
- 4221 Calimesa St
- 4161 Calimesa St
- 4211 Paramount St
- 4180 Studio St
- 4163 Paramount St
- 4152 Paramount St