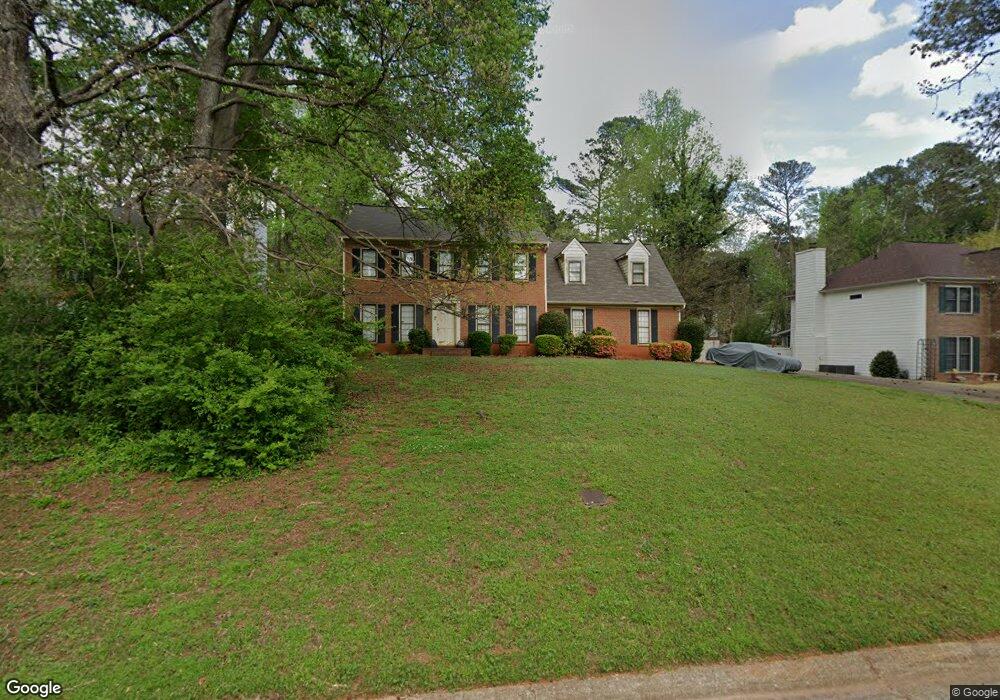
4193 Deerbrook Way SW Unit 2 Lilburn, GA 30047
Estimated Value: $421,000 - $452,000
4
Beds
3
Baths
2,391
Sq Ft
$181/Sq Ft
Est. Value
About This Home
This home is located at 4193 Deerbrook Way SW Unit 2, Lilburn, GA 30047 and is currently estimated at $433,900, approximately $181 per square foot. 4193 Deerbrook Way SW Unit 2 is a home located in Gwinnett County with nearby schools including Head Elementary School, Five Forks Middle School, and Brookwood High School.
Ownership History
Date
Name
Owned For
Owner Type
Purchase Details
Closed on
Mar 12, 2025
Sold by
Pacheco Mario R
Bought by
Pacheco Austin R
Current Estimated Value
Purchase Details
Closed on
Aug 30, 2002
Sold by
Casillas Luis A
Bought by
Cerda Lorena
Home Financials for this Owner
Home Financials are based on the most recent Mortgage that was taken out on this home.
Original Mortgage
$121,080
Interest Rate
6.4%
Mortgage Type
New Conventional
Purchase Details
Closed on
Sep 28, 1995
Sold by
Hickman Thomas K Diane M
Bought by
Casillas Luis A
Purchase Details
Closed on
Aug 29, 1994
Sold by
Cooper Vic Jane
Bought by
Hickman Thomas K Diane M
Home Financials for this Owner
Home Financials are based on the most recent Mortgage that was taken out on this home.
Original Mortgage
$141,550
Interest Rate
8.51%
Create a Home Valuation Report for This Property
The Home Valuation Report is an in-depth analysis detailing your home's value as well as a comparison with similar homes in the area
Home Values in the Area
Average Home Value in this Area
Purchase History
| Date | Buyer | Sale Price | Title Company |
|---|---|---|---|
| Pacheco Austin R | -- | -- | |
| Cerda Lorena | $151,400 | -- | |
| Casillas Luis A | $153,000 | -- | |
| Hickman Thomas K Diane M | $149,000 | -- |
Source: Public Records
Mortgage History
| Date | Status | Borrower | Loan Amount |
|---|---|---|---|
| Previous Owner | Cerda Lorena | $121,080 | |
| Previous Owner | Hickman Thomas K Diane M | $141,550 | |
| Closed | Casillas Luis A | $0 |
Source: Public Records
Tax History Compared to Growth
Tax History
| Year | Tax Paid | Tax Assessment Tax Assessment Total Assessment is a certain percentage of the fair market value that is determined by local assessors to be the total taxable value of land and additions on the property. | Land | Improvement |
|---|---|---|---|---|
| 2025 | $5,657 | $161,960 | $30,000 | $131,960 |
| 2024 | $5,684 | $157,160 | $30,000 | $127,160 |
| 2023 | $5,684 | $148,520 | $31,200 | $117,320 |
| 2022 | $3,998 | $138,800 | $27,600 | $111,200 |
| 2021 | $3,148 | $95,600 | $19,600 | $76,000 |
| 2020 | $3,169 | $95,600 | $19,600 | $76,000 |
| 2019 | $3,087 | $95,600 | $19,600 | $76,000 |
| 2018 | $2,943 | $88,840 | $19,600 | $69,240 |
| 2016 | $2,653 | $74,480 | $16,000 | $58,480 |
| 2015 | $2,627 | $72,240 | $14,000 | $58,240 |
| 2014 | $2,634 | $72,240 | $14,000 | $58,240 |
Source: Public Records
Map
Nearby Homes
- 1394 Rustlewood Ct SW
- 1102 Timber Glen Ct SW
- 1315 Killian Shoals Way SW
- 4327 Saint Michaels Dr SW
- 1043 Wash Lee Dr SW
- 1093 Hasty Ct SW
- 4070 Runnymede Dr SW
- 1535 Pathfinder Way SW Unit 1
- 4449 Amberleaf Walk
- 1530 Oleander Ln SW
- 1296 Lake Lucerne Rd SW
- 0 River Club Dr Unit 7650571
- 1640 Killian Hill Rd SW
- 3846 Teresa Terrace SW
- 4377 Hardwood Cir SW Unit 2
- 1725 Spindle Top Ct SW
- 4183 Deerbrook Way SW Unit 2
- 4111 Mayflower Ct SW
- 4173 Deerbrook Way SW
- 4213 Deerbrook Way SW
- 4103 Mayflower Ct SW Unit 2
- 4119 Mayflower Ct SW
- 4144 Timberlanes Way SW Unit 2
- 4145 Timberlanes Way SW
- 4095 Mayflower Ct SW
- 4163 Deerbrook Way SW
- 4172 Deerbrook Way SW Unit 2
- 0 Timberlanes Way SW
- 4223 Deerbrook Way SW
- 4136 Mayflower Ct SW
- 4212 Deerbrook Way SW
- 4087 Mayflower Ct SW
- 4154 Timberlanes Way SW
- 4155 Timberlanes Way SW
- 4162 Deerbrook Way SW
- 4112 Mayflower Ct SW