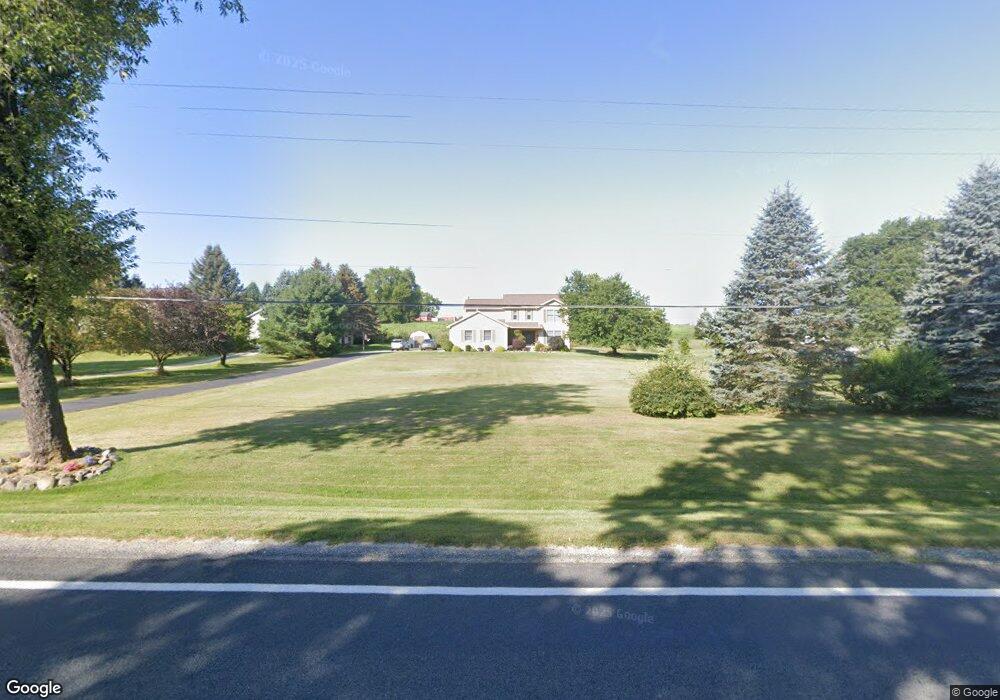
4193 Dexter Pinckney Rd Dexter, MI 48130
Estimated Value: $525,471 - $606,000
3
Beds
3
Baths
2,070
Sq Ft
$274/Sq Ft
Est. Value
About This Home
This home is located at 4193 Dexter Pinckney Rd, Dexter, MI 48130 and is currently estimated at $566,368, approximately $273 per square foot. 4193 Dexter Pinckney Rd is a home located in Washtenaw County with nearby schools including Bates Elementary School, Creekside Intermediate School, and Anchor Elementary School.
Ownership History
Date
Name
Owned For
Owner Type
Purchase Details
Closed on
Sep 28, 2003
Sold by
Galiyas David A and Galiyas Grayce M
Bought by
Roberts Daniel J and Roberts Debra K
Current Estimated Value
Home Financials for this Owner
Home Financials are based on the most recent Mortgage that was taken out on this home.
Original Mortgage
$211,600
Outstanding Balance
$100,637
Interest Rate
6.49%
Mortgage Type
Purchase Money Mortgage
Estimated Equity
$465,731
Purchase Details
Closed on
Oct 17, 1994
Sold by
Crestwood Bldrs Inc
Bought by
Galiyas David A and Galiyas Grayce M
Home Financials for this Owner
Home Financials are based on the most recent Mortgage that was taken out on this home.
Original Mortgage
$166,400
Interest Rate
8.53%
Mortgage Type
New Conventional
Create a Home Valuation Report for This Property
The Home Valuation Report is an in-depth analysis detailing your home's value as well as a comparison with similar homes in the area
Home Values in the Area
Average Home Value in this Area
Purchase History
| Date | Buyer | Sale Price | Title Company |
|---|---|---|---|
| Roberts Daniel J | $264,500 | -- | |
| Galiyas David A | -- | -- |
Source: Public Records
Mortgage History
| Date | Status | Borrower | Loan Amount |
|---|---|---|---|
| Open | Roberts Daniel J | $211,600 | |
| Previous Owner | Galiyas David A | $166,400 |
Source: Public Records
Tax History Compared to Growth
Tax History
| Year | Tax Paid | Tax Assessment Tax Assessment Total Assessment is a certain percentage of the fair market value that is determined by local assessors to be the total taxable value of land and additions on the property. | Land | Improvement |
|---|---|---|---|---|
| 2025 | $5,719 | $217,800 | $0 | $0 |
| 2024 | $1,745 | $206,300 | $0 | $0 |
| 2023 | $1,662 | $188,300 | $0 | $0 |
| 2022 | $5,466 | $176,100 | $0 | $0 |
| 2021 | $5,313 | $174,900 | $0 | $0 |
| 2020 | $5,248 | $170,800 | $0 | $0 |
| 2019 | $5,218 | $165,300 | $165,300 | $0 |
| 2018 | $5,114 | $165,600 | $0 | $0 |
| 2017 | $4,741 | $157,600 | $0 | $0 |
| 2016 | $1,383 | $130,191 | $0 | $0 |
| 2015 | -- | $129,802 | $0 | $0 |
| 2014 | -- | $125,747 | $0 | $0 |
| 2013 | -- | $125,747 | $0 | $0 |
Source: Public Records
Map
Nearby Homes
- 8218 Webster Dr
- 3221 Eastridge Dr Unit 66
- 8988 E Stoney Field Dr Unit 11
- 8180 Main St Unit 202
- 8180 Main St Unit 303
- 8180 Main St Unit 401
- 8180 Main St Unit 204
- 8180 Main St Unit 402
- 8180 Main St Unit 301
- 8180 Main St Unit 102
- 8180 Main St Unit 304
- 8180 Main St Unit 201
- 8180 Main St Unit 101
- 7783 Fischers Way
- 9161 Dogwood Ln
- 7737 Brass Creek
- 9430 Island Lake Rd
- 7603 Kingfisher Ct
- 621 Woodland Dr
- 4815 Wylie Rd
- 4221 Dexter Pinckney Rd
- 4165 Dexter Pinckney Rd
- 4153 Dexter Pinckney Rd
- 4153 Dexter-Pinckney Rd
- 8521 Parkridge Dr Unit 134
- 8525 Parkridge Dr Unit 133
- 8517 Parkridge Dr
- 8540 Island Lake Rd
- 8529 Parkridge Dr
- 8513 Parkridge Dr Unit 136
- 4289 Dexter Pinckney Rd
- 8509 Parkridge Dr Unit 137
- 8509 Parkridge Dr
- 8509 Parkridge # 137
- 8533 Parkridge Dr Unit 131
- 8503 Parkridge Dr Unit 138
- 8503 Parkridge Dr
- VACANT Parkridge
- 4311 Dexter-Pinckney Rd
- 4311 Dexter Pinckney Rd