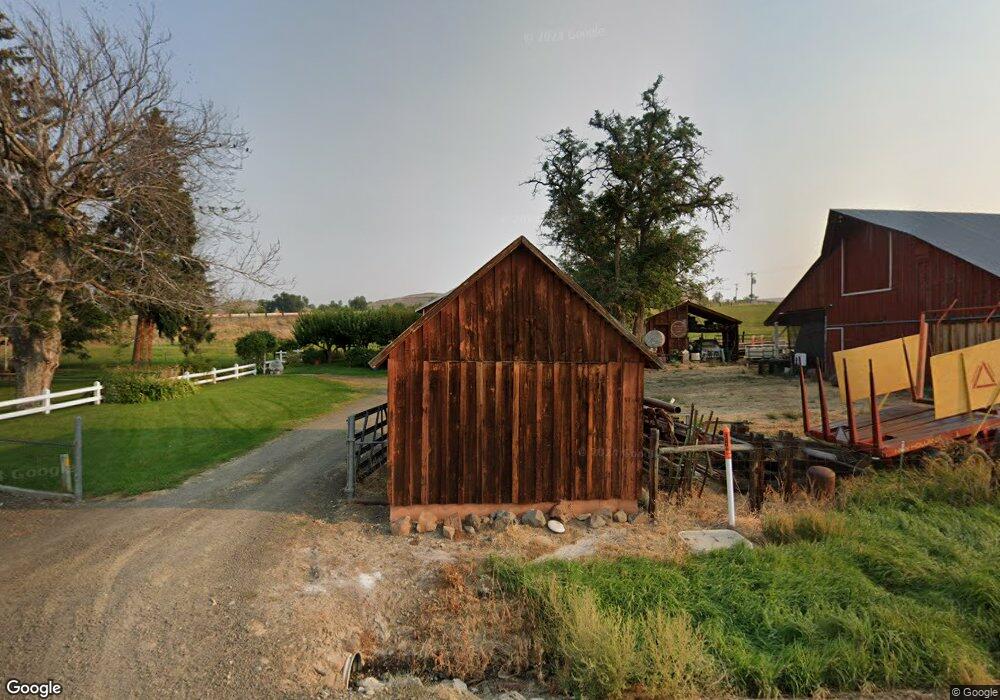
41933 Robinette Rd Richland, OR 97870
Estimated Value: $236,000 - $460,000
3
Beds
1
Bath
2,752
Sq Ft
$124/Sq Ft
Est. Value
About This Home
This home is located at 41933 Robinette Rd, Richland, OR 97870 and is currently estimated at $340,308, approximately $123 per square foot. 41933 Robinette Rd is a home located in Baker County with nearby schools including Pine Eagle Elementary School.
Create a Home Valuation Report for This Property
The Home Valuation Report is an in-depth analysis detailing your home's value as well as a comparison with similar homes in the area
Home Values in the Area
Average Home Value in this Area
Tax History Compared to Growth
Tax History
| Year | Tax Paid | Tax Assessment Tax Assessment Total Assessment is a certain percentage of the fair market value that is determined by local assessors to be the total taxable value of land and additions on the property. | Land | Improvement |
|---|---|---|---|---|
| 2024 | $1,796 | $149,608 | $5,560 | $144,048 |
| 2023 | $1,753 | $145,387 | $5,534 | $139,853 |
| 2022 | $1,703 | $141,290 | $5,510 | $135,780 |
| 2021 | $1,621 | $137,312 | $5,486 | $131,826 |
| 2020 | $1,585 | $133,451 | $5,464 | $127,987 |
| 2019 | $1,481 | $129,700 | $5,440 | $124,260 |
| 2018 | $1,427 | $124,619 | $5,419 | $119,200 |
| 2017 | $1,447 | $126,119 | $5,398 | $120,721 |
| 2016 | $1,433 | $122,582 | $5,377 | $117,205 |
| 2015 | $1,366 | $118,917 | $5,357 | $113,560 |
| 2014 | $1,285 | $111,408 | $5,338 | $106,070 |
| 2013 | -- | $87,585 | $5,319 | $82,266 |
Source: Public Records
Map
Nearby Homes
- 37102 Woods Ln
- 36975 Sullivan Ln
- 342 2nd Place
- 46131 Snake River Rd
- 42759 Moody Rd
- 38901 Highway 86
- 43186 New Bridge Rd
- 43580 Old Foothill Rd
- 43310 Eagle Creek Rd
- 42139 Dry Gulch Rd
- 0 Sawmill Cutoff Ln Unit 101194861
- 0 Sawmill Cutoff Ln Unit 504566982
- 238 W Dawson St
- 120 Valley St
- 142 S Pine St
- 37867 Highway 414
- 0 Kellogg St Unit 1 329204570
- 220 Kellog St
- 226 Center St
- 217 N Main St
- 41997 Holcomb Rd
- 41844 Robinette Rd
- 37149 Woods Ln
- 40536 Highway 86
- 40536 Highway 86
- 0 Robinette Rd
- 37044 Sullivan Ln
- 37328 Woods Ln
- 37150 Sullivan Ln
- 40946 Highway 86
- 36846 Sullivan Ln
- 41616 Robinette Rd
- 40308 Highway 86
- 40284 Highway 86
- 40254 Highway 86
- 40271 Highway 86
- 40248 Highway 86
- 42173 Moody Rd
- 40194 Highway 86
- 36626 Sullivan Ln